//+------------------------------------------------------------------+
//|                                                           HP.mq4 |
//+------------------------------------------------------------------+
#property indicator_chart_window
#property indicator_buffers 1
#property indicator_color1 Yellow

//Global constants
#define pi 3.141592653589793238462643383279502884197169399375105820974944592

//Input parameters
extern int nobs    =100000; //Number of bars to smooth
extern int FiltPer =12;    //Equivalent to SMA period

//Indicator buffers
double hpf[],lambda;

int init()
{
   lambda=0.0625/MathPow(MathSin(pi/FiltPer),4);
   SetIndexBuffer(0,hpf);
   SetIndexStyle(0,DRAW_LINE);
   return(0);
}
//+----------------------------------------------------------------------------------------+
int start()
{
   double x[];
   ArrayResize(x,nobs);
   for(int i=0;i<nobs;i++) x[i]=Close[i];
   HPF(nobs,lambda,x,hpf);
   return(0);
}
// Hodrick-Prescott Filter-----------------------------------------------------------------+
void HPF(int nobs, double lambda, double x[], double& y[])
{
   double a[],b[],c[],H1,H2,H3,H4,H5,HH1,HH2,HH3,HH4,HH5,HB,HC,Z;
   ArrayResize(a,nobs);
   ArrayResize(b,nobs);
   ArrayResize(c,nobs);

   a[0]=1.0+lambda;
   b[0]=-2.0*lambda;
   c[0]=lambda;
   for(int i=1;i<nobs-2;i++)
   {
      a[i]=6.0*lambda+1.0;
      b[i]=-4.0*lambda;
      c[i]=lambda;
   }
   a[1]=5.0*lambda+1;
   a[nobs-1]=1.0+lambda;
   a[nobs-2]=5.0*lambda+1.0;
   b[nobs-2]=-2.0*lambda;
   b[nobs-1]=0.0;
   c[nobs-2]=0.0;
   c[nobs-1]=0.0;

   //Forward
   for(i=0;i<nobs;i++)
   {
      Z=a[i]-H4*H1-HH5*HH2;
      HB=b[i];
      HH1=H1;
      H1=(HB-H4*H2)/Z;
      b[i]=H1;
      HC=c[i];
      HH2=H2;
      H2=HC/Z;
      c[i]=H2;
      a[i]=(x[i]-HH3*HH5-H3*H4)/Z;
      HH3=H3;
      H3=a[i];
      H4=HB-H5*HH1;
      HH5=H5;
      H5=HC;
   }

   //Backward
   H2=0;
   H1=a[nobs-1];
   y[nobs-1]=H1;
   for(i=nobs-2;i>=0;i--)
   {
      y[i]=a[i]-b[i]*H1-c[i]*H2;
      H2=H1;
      H1=y[i];
   }
}
Sample
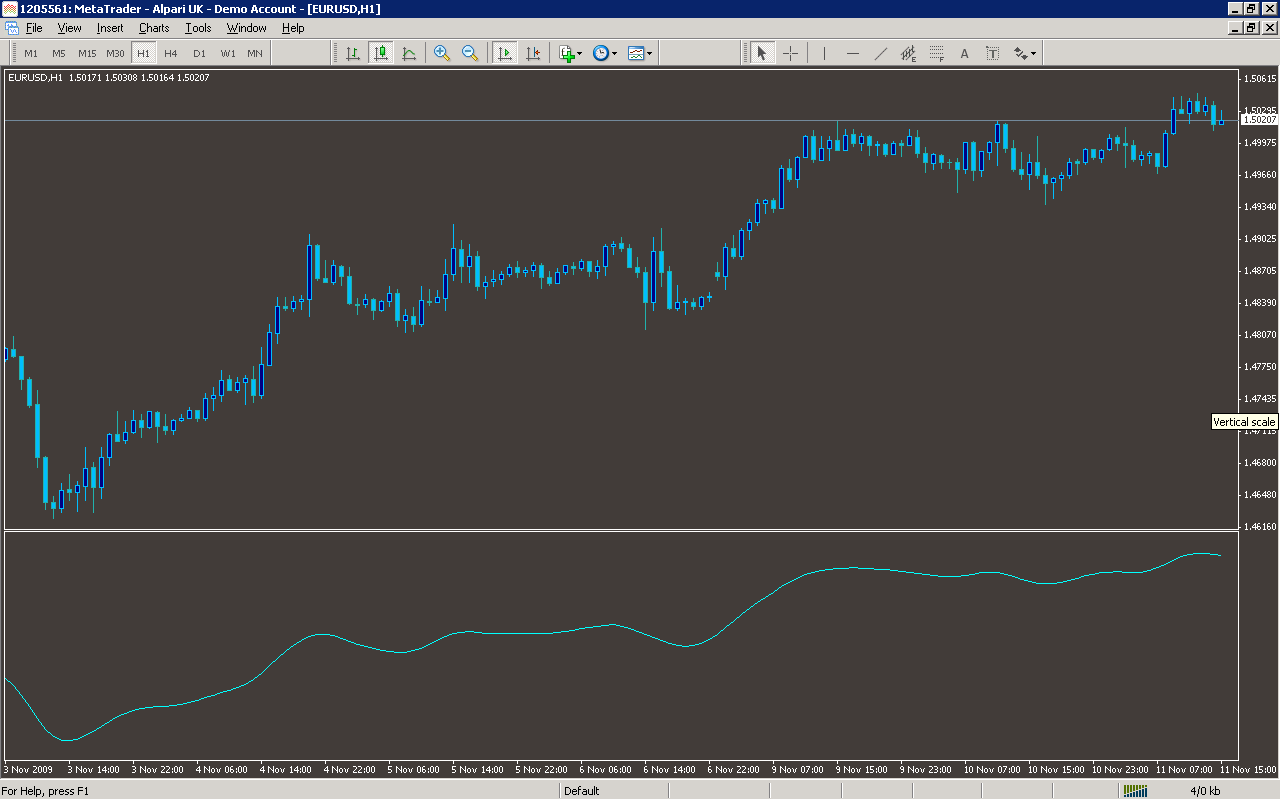
Analysis
Market Information Used:
Series array that contains close prices for each bar
Indicator Curves created:
Implements a curve of type DRAW_LINE
Indicators Used:
Custom Indicators Used:
Order Management characteristics:
Other Features: