//+------------------------------------------------------------------+
//|                                      LinearRegressionChannel.mq4 |
//|                                                           dimicr |
//|                                         http://www.signalsbg.com |
//|      SignalsBG.com - development of trading tools for Metatrader |
//////////////////////////////////////////////////////////////////////
#property copyright "Copyright © 2008 signalsbg.com"
#property link      "http://www.signalsbg.com"
#property indicator_chart_window

#property indicator_buffers 3
#property indicator_width1 1
#property indicator_width2 1
#property indicator_width3 1
#property indicator_color1 Gold
#property indicator_color2 Aqua
#property indicator_color3 OrangeRed

extern bool UseClose = true;
extern int  barsToCount=50;

double LR_line[];
double Sup_line[];
double Res_line[];

//////////////////////////////////////////////////////////////////////
int init()
{
   //IndicatorShortName("LinearRegressionChannel:"+barsToCount);
   SetIndexStyle(0,DRAW_LINE);
   SetIndexBuffer(0,LR_line);
   SetIndexEmptyValue(0,0.0);

   SetIndexStyle(1,DRAW_LINE);
   SetIndexBuffer(1,Sup_line);
   SetIndexEmptyValue(1,0.0);

   SetIndexStyle(2,DRAW_LINE);
   SetIndexBuffer(2,Res_line);
   SetIndexEmptyValue(2,0.0);


   return(0);
}

//////////////////////////////////////////////////////////////////////
int deinit()
{
   return(0);
}

//////////////////////////////////////////////////////////////////////
int start()
{
   // variables
   double a,b,c,
          sumy=0.0,
          sumx=0.0,
          sumxy=0.0,
          sumx2=0.0,
          h=0.0,l=0.0;
   int x;

   // calculate linear regression

   for(int i=0; i<barsToCount; i++)
   {
      sumy+=Close[i];
      sumxy+=Close[i]*i;
      sumx+=i;
      sumx2+=i*i;
   }

   c=sumx2*barsToCount-sumx*sumx;

   if(c==0.0)
   {
      Alert("Error in linear regression!");
      return;
   }


   // Line equation
   b=(sumxy*barsToCount-sumx*sumy)/c;
   a=(sumy-sumx*b)/barsToCount;

   // Linear regression line in buffer
   for(x=0;x<barsToCount;x++)
      LR_line[x]=a+b*x;


   // Use PRICE_CLOSE for support-resistance
   if (UseClose)
     for(x=0;x<barsToCount;x++)
     {
       if(Close[x]-LR_line[x] > h) h = Close[x]-LR_line[x];
       if(LR_line[x] - Close[x]> l) l = LR_line[x] - Close[x];
     }

   // Use HIGH - LOW
   else
     for(x=0;x<barsToCount;x++)
     {
       if(High[x]-LR_line[x] > h) h = High[x]-LR_line[x];
       if(LR_line[x] - Low[x]> l) l = LR_line[x] - Low[x];
     }

   // Drawing support - resistance lines
   if (h>l)
   {
     for(x=0;x<barsToCount;x++)
     {
       Sup_line[x]=a-h+b*x;
       Res_line[x]=a+h+b*x;
     }
   }
   else
   {
     for(x=0;x<barsToCount;x++)
     {
       Sup_line[x]=a-l+b*x;
       Res_line[x]=a+l+b*x;
     }
   }

   LR_line[x]  = 0.0;
   Sup_line[x] = 0.0;
   Res_line[x] = 0.0;

   return(0);
}
Sample
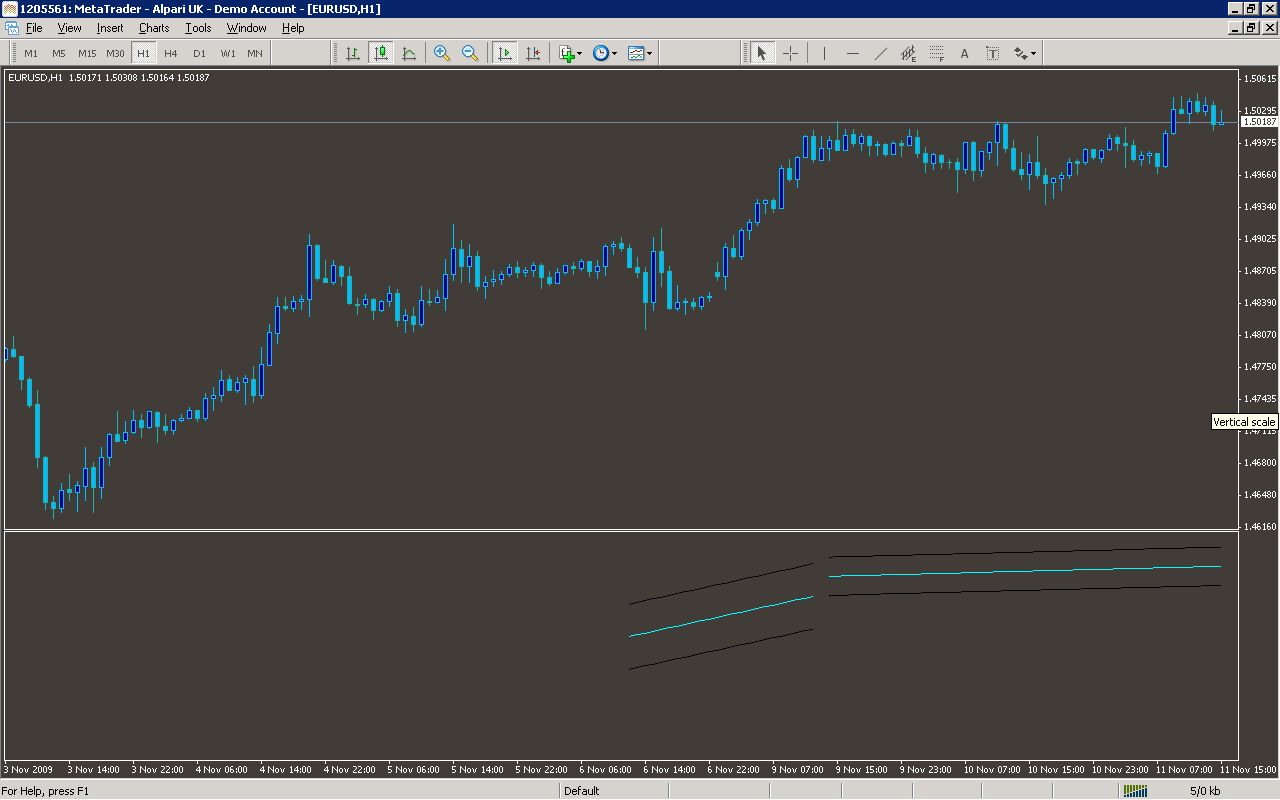
Analysis
Market Information Used:
Series array that contains close prices for each bar
Series array that contains the highest prices of each bar
Series array that contains the lowest prices of each bar
Indicator Curves created:
Implements a curve of type DRAW_LINE
Indicators Used:
Custom Indicators Used:
Order Management characteristics:
Other Features:
It issuies visual alerts to the screen