//+-------------------------------------------------------------------+
//|                                                                   |
//|                       Copyright © 2004, MetaQuotes Software Corp. |
//|                                         http://www.metaquotes.net |
//|                  tweaked by accrete at accrete.com                |
//+-------------------------------------------------------------------+
#property copyright "Copyright © 2004, MetaQuotes Software Corp."
#property link      "http://www.metaquotes.net"

#property indicator_chart_window

extern int Time_Shift=23;//set to = 16:00 New York on your broker feed

extern bool Previous_Session_H_M_L = false;
extern bool Show_Yesterdays_Close = true;
extern bool Show_Yesterdays_Open = true;


double Session_HML=0;
double day_high=0;
double day_low=0;
double yesterday_high=0;
double yesterday_open=0;
double yesterday_low=0;
double yesterday_close=0;
double today_open=0;
double today_high=0;
double today_low=0;
double P=0;//Prior Session Open
double Q=0;
double Y1; //Prior Session Close
double R1,R2,R3;
double M0,M1,M2,M3,M4,M5;
double S1,S2,S3;
double HBu6,HBu5,HBu4,HBu3,HBu2,HBu1;
double HBd6,HBd5,HBd4,HBd3,HBd2,HBd1;
double L4,L3;
double nQ=0;
double nD=0;
double D=0;
double rates_h1[2][6];
double rates_d1[2][6];

//+------------------------------------------------------------------+
//| Custom indicator initialization function                         |
//+------------------------------------------------------------------+
int init()
  {
//---- indicators
 R1=0; R2=0; R3=0;
 M0=0; M1=0; M2=0; M3=0; M4=0; M5=0;
 S1=0; S2=0; S3=0;
 HBu6=0; HBu5=0; HBu4=0; HBu3=0; HBu2=0; HBu1=0;
 HBd6=0; HBd5=0; HBd4=0; HBd3=0; HBd2=0; HBd1=0;
 L4=0; L3=0;
 Y1=0;


//----
   return(0);
  }
//+------------------------------------------------------------------+
//| Custor indicator deinitialization function                       |
//+------------------------------------------------------------------+
int deinit()
  {
//---- TODO: add your code here
ObjectDelete("R1 Label");
ObjectDelete("R1 Line");
ObjectDelete("R2 Label");
ObjectDelete("R2 Line");
ObjectDelete("R3 Label");
ObjectDelete("R3 Line");
ObjectDelete("S1 Label");
ObjectDelete("S1 Line");
ObjectDelete("S2 Label");
ObjectDelete("S2 Line");
ObjectDelete("S3 Label");
ObjectDelete("S3 Line");
ObjectDelete("P Label");
ObjectDelete("P Line");
ObjectDelete("Y1 Label");
ObjectDelete("Y1 Line");


ObjectDelete("L3 Label");
ObjectDelete("L3 Line");
ObjectDelete("L4 Label");
ObjectDelete("L4 Line");
ObjectDelete("M5 Label");
ObjectDelete("M5 Line");
ObjectDelete("M4 Label");
ObjectDelete("M4 Line");
ObjectDelete("M3 Label");
ObjectDelete("M3 Line");
ObjectDelete("M2 Label");
ObjectDelete("M2 Line");
ObjectDelete("M1 Label");
ObjectDelete("M1 Line");
ObjectDelete("M0 Label");
ObjectDelete("M0 Line");
//----
   return(0);
  }
//+------------------------------------------------------------------+
//| Custom indicator iteration function                              |
//+------------------------------------------------------------------+
int start()
  {
      int i=0, j=0;
//---- TODO: add your code here

//---- exit if period is greater than daily charts
if(Period() > 1440)
{
Print("Error - Chart period is greater than 1 day.");
return(-1); // then exit
}

//---- Get new daily prices

ArrayCopyRates(rates_d1, Symbol(), PERIOD_D1);
yesterday_high = rates_d1[1][3];
yesterday_low = rates_d1[1][2];
day_high = rates_d1[0][3];
day_low = rates_d1[0][2];

ArrayCopyRates(rates_h1, Symbol(), PERIOD_H1);
for (i=0;i<=25;i++)
{
   if (TimeMinute(rates_h1[i][0])==0 && (TimeHour(rates_h1[i][0])-Time_Shift)==0)
   {
      yesterday_close = rates_h1[i+1][4];
      yesterday_open = rates_h1[i+24][1];
      today_open = rates_h1[i][1];
      break;
   }
}

//---- Calculate ATM_Pivots

D = (day_high - day_low);
Q = (yesterday_high - yesterday_low);
// P = yesterday_close;
R2 = yesterday_close+(Q*0.50);
R1 = yesterday_close+(Q*0.35);
S1 = yesterday_close-(Q*0.35);
S2 = yesterday_close-(Q*0.50);
//P = (yesterday_high + yesterday_low + yesterday_close) / 3; //original pivot code

// Previous Days High, Median, and Low:
M3 = (yesterday_high + yesterday_low)/2;
M2 = yesterday_low;
M1 = yesterday_high;
P = yesterday_open;
Y1 = yesterday_close;


//H4 = (Q*0.55)+yesterday_close;
// H3 = yesterday_close+(Q*0.125);
//R3 = (2*P)+(yesterday_high-(2*yesterday_low));

	/*Original R/S code:
	R1 = (2*P)-yesterday_low;
S1 = (2*P)-yesterday_high;
R2 = P+(yesterday_high - yesterday_low);
S2 = P-(yesterday_high - yesterday_low);
*/


//M5 = (R2+R3)/2;
//	R2 = P-S1+R1;
//M4 = (R1+R2)/2;
//	R1 = (2*P)-yesterday_low;
//M3 = (P+R1)/2;
//	P = (yesterday_high + yesterday_low + yesterday_close)/3;
//M2 = (P+S1)/2;
//	S1 = (2*P)-yesterday_high;
//M1 = (S1+S2)/2;
//	S2 = P-R1+S1;
//S3 = (2*P)-((2* yesterday_high)-yesterday_low);
//L3 = yesterday_close-(Q*0.27);
//L4 = yesterday_close-(Q*0.55);
//M0 = (S2+S3)/2;

if (Q > 5)
{
	nQ = Q;
}
else
{
	nQ = Q*10000;
}

if (D > 5)
{
	nD = D;
}
else
{
	nD = D*10000;
}
Comment("$TrillionStrategy           Prior Range = ",nQ,"        Current Range = ",nD, "\nSession Open = ", yesterday_open,"      Session Close = ",yesterday_close);

//---- Set line labels on chart window


//------ Midpoints ATM_Pivots

   if (Previous_Session_H_M_L==true)
   {

      if(ObjectFind("M3 label") != 0)
      {
      ObjectCreate("M3 label", OBJ_TEXT, 0, CurTime(), M3);
      ObjectSetText("M3 label", "                                              sM", 8, "Arial", Violet);
      }
      else
      {
      ObjectMove("M3 label", 0, CurTime(), M3);
      }

      if(ObjectFind("M2 label") != 0)
      {
      ObjectCreate("M2 label", OBJ_TEXT, 0, CurTime(), M2);
      ObjectSetText("M2 label", "                                              sL", 8, "Arial", Red);
      }
      else
      {
      ObjectMove("M2 label", 0, CurTime(), M2);
      }

      if(ObjectFind("M1 label") != 0)
      {
      ObjectCreate("M1 label", OBJ_TEXT, 0, CurTime(), M1);
      ObjectSetText("M1 label", "                                              sH", 8, "Arial", Lime);
      }
      else
      {
      ObjectMove("M1 label", 0, CurTime(), M1);
      }

      if(ObjectFind("M3 line") != 0)
      {
      ObjectCreate("M3 line", OBJ_HLINE, 0, Time[40], M3);
      ObjectSet("M3 line", OBJPROP_STYLE, STYLE_DASHDOT);
      ObjectSet("M3 line", OBJPROP_COLOR, Violet);
      }
      else
      {
      ObjectMove("M3 line", 0, Time[40], M3);
      }

      if(ObjectFind("M2 line") != 0)
      {
      ObjectCreate("M2 line", OBJ_HLINE, 0, Time[40], M2);
      ObjectSet("M2 line", OBJPROP_STYLE, STYLE_DASHDOT);
      ObjectSet("M2 line", OBJPROP_COLOR, Red);
      }
      else
      {
      ObjectMove("M2 line", 0, Time[40], M2);
      }

      if(ObjectFind("M1 line") != 0)
      {
      ObjectCreate("M1 line", OBJ_HLINE, 0, Time[40], M1);
      ObjectSet("M1 line", OBJPROP_STYLE, STYLE_DASHDOT);
      ObjectSet("M1 line", OBJPROP_COLOR, Lime);
      }
      else
      {
      ObjectMove("M1 line", 0, Time[40], M1);
      }
 }

    if (Show_Yesterdays_Close==true)
   {
           if(ObjectFind("P label") != 0)
      {
      ObjectCreate("P label", OBJ_TEXT, 0, CurTime(), P);
      ObjectSetText("P label", "                       Open", 8, "Arial", Lime);
      }
      else
      {
      ObjectMove("P label", 0, CurTime(), P);
      }
            if(ObjectFind("P line") != 0)
      {
      ObjectCreate("P line", OBJ_HLINE, 0, Time[40], P);
      ObjectSet("P line", OBJPROP_STYLE, STYLE_DOT);
      ObjectSet("P line", OBJPROP_COLOR, Lime);
      }
      else
      {
      ObjectMove("P line", 0, Time[40], P);
      }

}
 //------ Show Yesterday's Open:

 if ( Show_Yesterdays_Open==true)
   {
           if(ObjectFind("Y1 label") != 0)
      {
      ObjectCreate("Y1 label", OBJ_TEXT, 0, CurTime(), Y1);
      ObjectSetText("Y1 label", "                       Close", 8, "Arial", Red);
      }
      else
      {
      ObjectMove("Y1 label", 0, CurTime(), Y1);
      }
            if(ObjectFind("Y1 line") != 0)
      {
      ObjectCreate("Y1 line", OBJ_HLINE, 0, Time[40], Y1);
      ObjectSet("Y1 line", OBJPROP_STYLE, STYLE_DOT);
      ObjectSet("Y1 line", OBJPROP_COLOR, Red);
      }
      else
      {
      ObjectMove("Y1 line", 0, Time[40], Y1);
      }

}
//----End of Midpoint Pivots Draw

//---- End Of Program
   return(0);
  }
//+------------------------------------------------------------------+
Sample
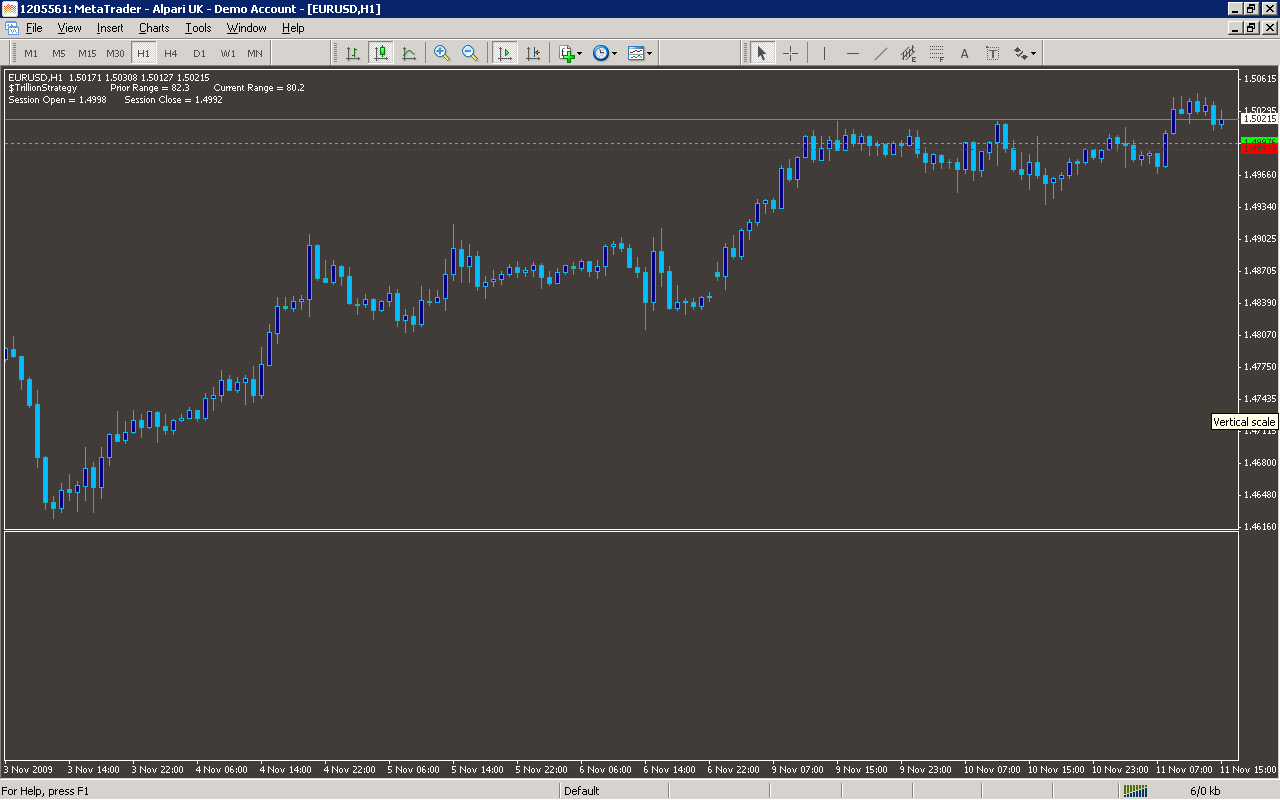
Analysis
Market Information Used:
Series array that contains open time of each bar
Indicator Curves created:
Indicators Used:
Custom Indicators Used:
Order Management characteristics:
Other Features: