//+------------------------------------------------------------------+
//|                                           correlation_2pairs.mq4 |
//|                                         Copyright © 2006, zolero |
//|                                        http://www.mt ©etatrader.com |
//+------------------------------------------------------------------+
#property copyright "Copyright © 2006, zolero"
#property link      "http://www."

#property indicator_separate_window

datetime x;
#property indicator_buffers 3
#property indicator_color1 Red
IndicatorDigits(Digits+10);
SetLevelValue(-1,1);
//#property indicator_color2 Blue
//#property indicator_color3 Green
extern string Pair1="GBPUSD";
//extern string Pair2="GBPUSD";
//extern string Pair3="AUDUSD";
extern int    Periood=4;
double Correl1_Buffer[];
  double array11[];
//  double array22[];

//+------------------------------------------------------------------+
//| Custom indicator initialization function                         |
//+------------------------------------------------------------------+
int init()
  {

IndicatorBuffers(3);

//---- indicators
string short_name;
   SetIndexStyle(0,DRAW_LINE,0,1,Red);
   SetIndexBuffer(0,Correl1_Buffer);

   SetIndexBuffer(1,array11);
   SetIndexStyle(1,DRAW_LINE);

//   SetIndexBuffer(2,array22);
 //  SetIndexStyle(2,DRAW_NONE);
 // short_name="Correlation";

   //IndicatorShortName("Correlation("+Correl1_Buffer[1]+")");
  // IndicatorShortName(short_name);
  // SetIndexLabel(0,Pair1+"/"+Pair2);

//----

   return(0);
  }
//+------------------------------------------------------------------+
//| Custom indicator deinitialization function                       |
//+------------------------------------------------------------------+
int deinit()
  {
//----


//----
   return(0);
  }
//+------------------------------------------------------------------+
//| Custom indicator iteration function                              |
//+------------------------------------------------------------------+
int start()
  {
   int    counted_bars=IndicatorCounted();
   int    limit=BarsPerWindow();
   int koht, count, shift;
double sum1,sum11, sum2,sum22, correl, first,first1,second1,third1, second, third, average1, average2;
//----

  double array1[][6];


  shift=1;
  if(x!=iTime(NULL, 0, 0)) shift=limit;//makes only by creation of a new bar

  ArrayCopyRates(array1, Pair1, NULL);


  koht=4;
  count=ArraySize(array1);


while(shift>0)
 {

  first1=0; second1=0; third1=0;
  for(int c=1; c<Periood; c++)
   {
      first1=(((array1[shift][koht])-(array1[shift+1][koht]))/(array1[shift+1][koht]))*100;


   }

   array11[shift]=first1;

  shift--;
 }
  // Print("percent change:  ",array11[1], "   array   ",array1[shift][koht],"  ",array1[shift+1][koht]);


  shift=1;
  if(x!=iTime(NULL, 0, 0)) shift=limit;//makes only by creation of a new bar


ArraySetAsSeries(array11,true);


while(shift>0)
 {
  sum1=0; sum2=0;
  for(int i=1; i<Periood; i++)
   {
      sum1+=array1[shift+i][koht];
      sum2+=array11[shift+i];
   }
  average1=sum1/(Periood-1);
  average2=sum2/(Periood-1);
  first=0; second=0; third=0;
  for(c=1; c<Periood; c++)
   {
      first+=(array1[shift+c][koht]-average1)*(array11[shift+c]-average2);
      second+=MathPow((array1[shift+c][koht]-average1), 2.0);
      third+=MathPow((array11[shift+c]-average2), 2.0);

   }
   //Print(first,"    ",second,"   ",third);
   Correl1_Buffer[shift]=first/(MathSqrt(second*third));
  shift--;
 }
   x=iTime(NULL, 0, 0);

//----
   return;
  }
//+------------------------------------------------------------------+
Sample
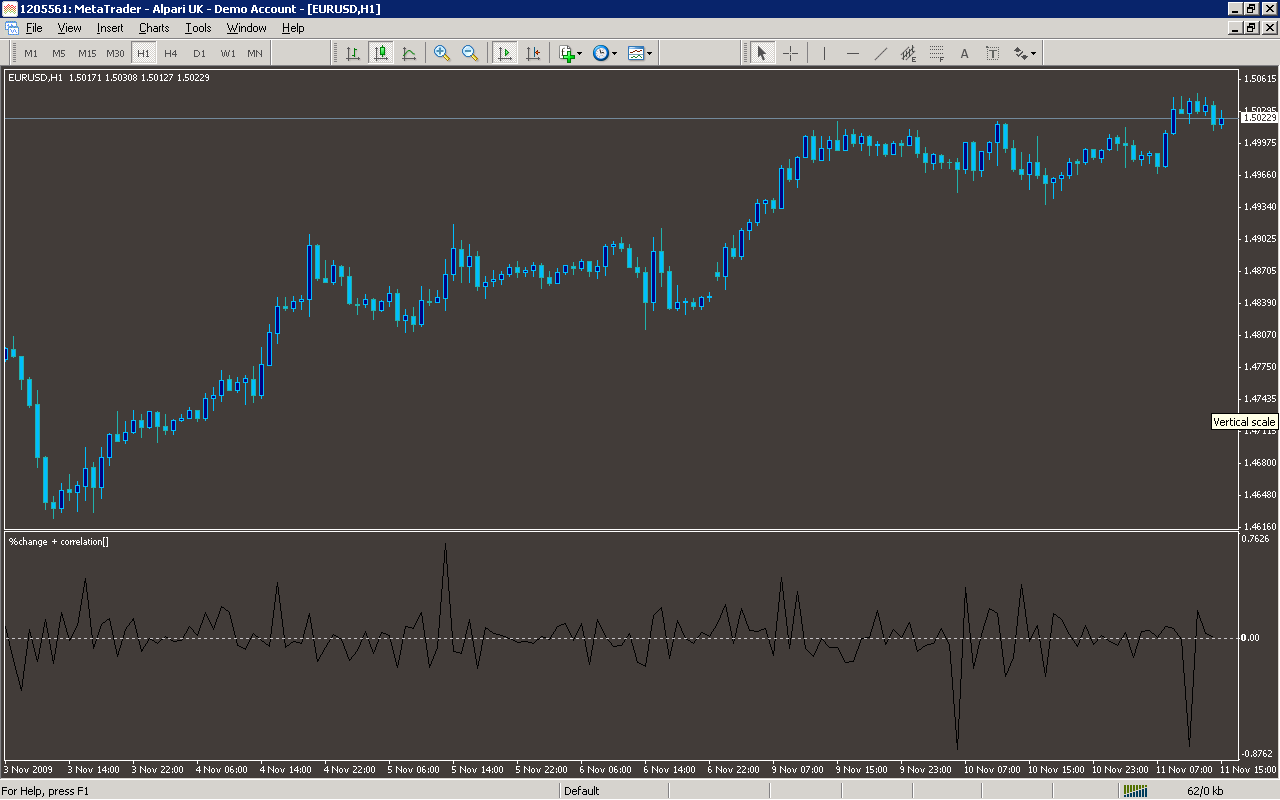
Analysis
Market Information Used:
Indicator Curves created:
Implements a curve of type DRAW_LINE
Indicators Used:
Custom Indicators Used:
Order Management characteristics:
Other Features: