//+------------------------------------------------------------------+
//|                                                        Pivot.mq4 |
//|                               Copyright © 2004, Poul_Trade_Forum |
//|                                                         Aborigen |
//|                                          http://forex.kbpauk.ru/ |
//+------------------------------------------------------------------+
#property copyright "Poul Trade Forum"
#property link      "http://forex.kbpauk.ru/"

#property indicator_chart_window
//#property indicator_separate_window
#property indicator_buffers 7
#property indicator_color1 Orange
#property indicator_color2 DarkGreen
#property indicator_color3 DarkGreen
#property indicator_color4 Maroon
#property indicator_color5 Maroon
#property indicator_color6 DarkOrchid
#property indicator_color7 DarkOrchid
//---- input parameters

//---- buffers
double PBuffer[];
double S1Buffer[];
double R1Buffer[];
double S2Buffer[];
double R2Buffer[];
double S3Buffer[];
double R3Buffer[];
string Pivot="Pivot Point",Sup1="S 1", Res1="R 1";
string Sup2="S 2", Res2="R 2", Sup3="S 3", Res3="R 3";
int fontsize=10;
double P,S1,R1,S2,R2,S3,R3;
double LastHigh,LastLow,x;

//+------------------------------------------------------------------+
//| Custor indicator deinitialization function                       |
//+------------------------------------------------------------------+
void deinit() {
  ObjectDelete("Pivot");
  ObjectDelete("Sup1");
  ObjectDelete("Res1");
  ObjectDelete("Sup2");
  ObjectDelete("Res2");
  ObjectDelete("Sup3");
  ObjectDelete("Res3");
}

//+------------------------------------------------------------------+
//| Custom indicator initialization function                         |
//+------------------------------------------------------------------+
void init() {
  string short_name;

  SetIndexStyle(0,DRAW_LINE,0,1);
  SetIndexStyle(1,DRAW_LINE,2,1);
  SetIndexStyle(2,DRAW_LINE,2,1);
  SetIndexStyle(3,DRAW_LINE,2,1);
  SetIndexStyle(4,DRAW_LINE,2,1);
  SetIndexStyle(5,DRAW_LINE,2,1);
  SetIndexStyle(6,DRAW_LINE,2,1);
  SetIndexBuffer(0,PBuffer);
  SetIndexBuffer(1,S1Buffer);
  SetIndexBuffer(2,R1Buffer);
  SetIndexBuffer(3,S2Buffer);
  SetIndexBuffer(4,R2Buffer);
  SetIndexBuffer(5,S3Buffer);
  SetIndexBuffer(6,R3Buffer);

//---- name for DataWindow and indicator subwindow label
  short_name="";
  IndicatorShortName(short_name);
  SetIndexLabel(0,short_name);

//----
  SetIndexDrawBegin(0,1);
}

//+------------------------------------------------------------------+
//| Custom indicator iteration function                              |
//+------------------------------------------------------------------+
void start() {
  int counted_bars=IndicatorCounted();
  int limit, i;

  if (counted_bars==0) {
    x=Period();
    if (x>240) return;
    ObjectCreate("Pivot", OBJ_TEXT, 0, 0,0);
    ObjectSetText("Pivot", " Pivot Point",fontsize,"Tahoma",indicator_color1);
    ObjectCreate("Sup1", OBJ_TEXT, 0, 0, 0);
    ObjectSetText("Sup1", "      S 1",fontsize,"Tahoma",indicator_color2);
    ObjectCreate("Res1", OBJ_TEXT, 0, 0, 0);
    ObjectSetText("Res1", "      R 1",fontsize,"Tahoma",indicator_color3);
    ObjectCreate("Sup2", OBJ_TEXT, 0, 0, 0);
    ObjectSetText("Sup2", "      S 2",fontsize,"Tahoma",indicator_color4);
    ObjectCreate("Res2", OBJ_TEXT, 0, 0, 0);
    ObjectSetText("Res2", "      R 2",fontsize,"Tahoma",indicator_color5);
    ObjectCreate("Sup3", OBJ_TEXT, 0, 0, 0);
    ObjectSetText("Sup3", "      S 3",fontsize,"Tahoma",indicator_color6);
    ObjectCreate("Res3", OBJ_TEXT, 0, 0, 0);
    ObjectSetText("Res3", "      R 3",fontsize,"Tahoma",indicator_color7);
  }
  if(counted_bars<0) return;
//---- last counted bar will be recounted
//   if(counted_bars>0) counted_bars--;
  limit=(Bars-counted_bars)-1;


  for (i=limit; i>=0; i--) {
    if (High[i+1]>LastHigh) LastHigh=High[i+1];
    if (Low[i+1]<LastLow) LastLow=Low[i+1];
    if (TimeDay(Time[i])!=TimeDay(Time[i+1])) {
      P=(LastHigh+LastLow+Close[i+1])/3;
      R1=(2*P)-LastLow;
      S1=(2*P)-LastHigh;
      R2=P+(LastHigh-LastLow);
      S2=P-(LastHigh-LastLow);
      R3=(2*P)+(LastHigh-(2*LastLow));
      S3=(2*P)-((2*LastHigh)-LastLow);
      LastLow=Open[i]; LastHigh=Open[i];

      ObjectMove("Pivot", 0, Time[i],P);
      ObjectMove("Sup1" , 0, Time[i],S1);
      ObjectMove("Res1" , 0, Time[i],R1);
      ObjectMove("Sup2" , 0, Time[i],S2);
      ObjectMove("Res2" , 0, Time[i],R2);
      ObjectMove("Sup3" , 0, Time[i],S3);
      ObjectMove("Res3" , 0, Time[i],R3);
    }
    PBuffer[i]=P;
    S1Buffer[i]=S1;
    R1Buffer[i]=R1;
    S2Buffer[i]=S2;
    R2Buffer[i]=R2;
    S3Buffer[i]=S3;
    R3Buffer[i]=R3;
  }
}
//+------------------------------------------------------------------+
Sample
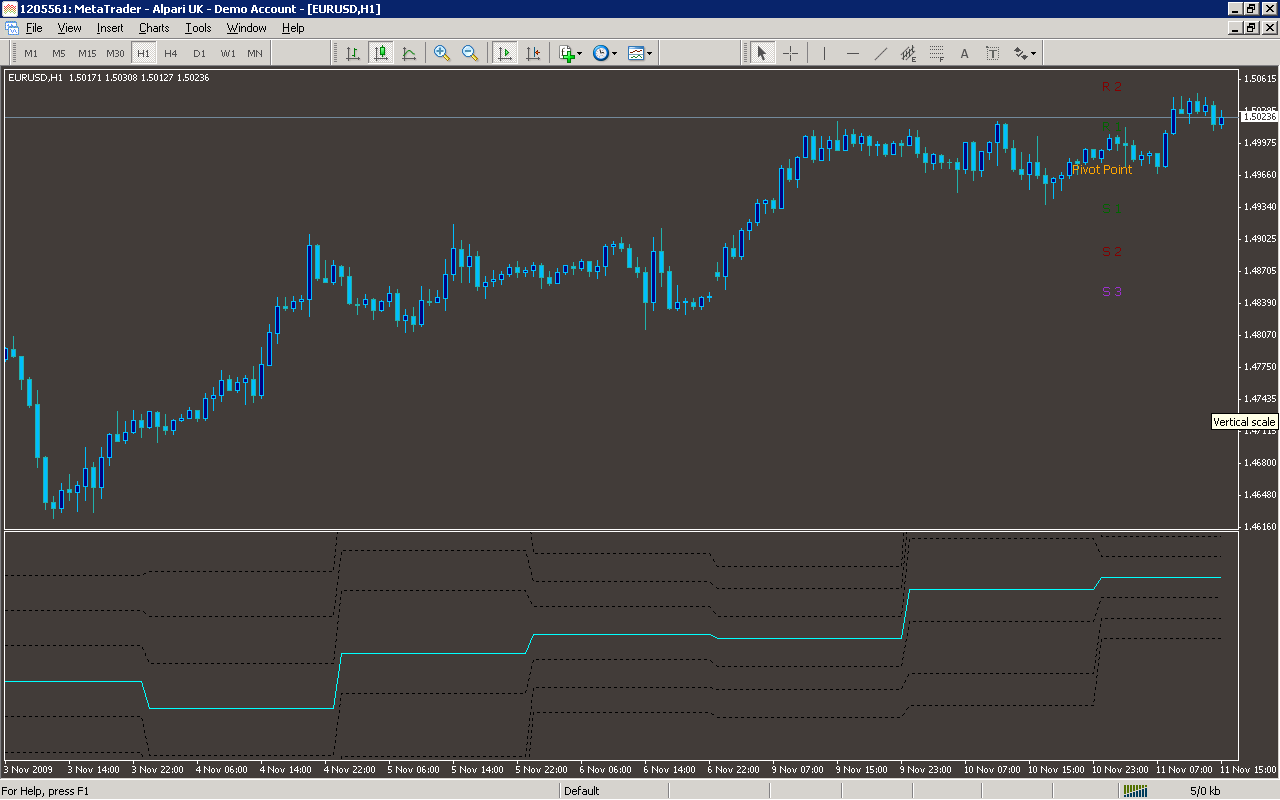
Analysis
Market Information Used:
Series array that contains the highest prices of each bar
Series array that contains the lowest prices of each bar
Series array that contains open time of each bar
Series array that contains close prices for each bar
Series array that contains open prices of each bar
Indicator Curves created:
Implements a curve of type DRAW_LINE
Indicators Used:
Custom Indicators Used:
Order Management characteristics:
Other Features: