/*-----------------------------+
|			       |
| Shared by www.Aptrafx.com    |
|			       |
+------------------------------*/

//+-----------+
//| TwoPerBar |
//+-----------+
#property copyright "Ron Thompson"
#property link      "http://www.lightpatch.com/forex/"

#property indicator_chart_window
#property indicator_buffers 2
#property indicator_color1 DodgerBlue
#property indicator_color2 Magenta

extern double BDistance    =      14;    // plus how much
extern int    BPeriod      =      15;    // Bollinger period
extern int    Deviation    =       2;    // Bollinger deviation

//---- buffers
double val1[];
double val2[];

//+----------------+
//| Custom DE-init |
//+----------------+
// Called ONCE when EA is removed from chart

int deinit()
  {
   int    i;
   string o;

   //remove the old objects
   for(i=0; i<Bars; i++)
     {
      o=DoubleToStr(i,0);
      ObjectDelete("myx"+o);
     }
   Print("DE-Init happened ",CurTime());
   Comment(" ");
  }


//+------------------------------------------------------------------+
//| Custom indicator initialization function                         |
//+------------------------------------------------------------------+
int init()
  {
   IndicatorBuffers(2);

   SetIndexStyle(0,DRAW_ARROW);
   SetIndexArrow(0,233);
   SetIndexBuffer(0,val1);

   SetIndexStyle(1,DRAW_ARROW);
   SetIndexArrow(1,234);
   SetIndexBuffer(1,val2);
  }


//+-----+
//| TPB |
//+-----+
int start()
  {

   int i;
   int mybars=2000;

   double bup=iBands(Symbol(),0,BPeriod,Deviation,0,PRICE_OPEN,MODE_UPPER,0);
   double bdn=iBands(Symbol(),0,BPeriod,Deviation,0,PRICE_OPEN,MODE_LOWER,0);


   for (i=mybars; i>=0; i--)
     {
      bup=iBands(Symbol(),0,BPeriod,Deviation,0,PRICE_OPEN,MODE_UPPER,i);
      bdn=iBands(Symbol(),0,BPeriod,Deviation,0,PRICE_OPEN,MODE_LOWER,i);

      if( High[i]>=bup+(14*Point) )
        {
         val2[i]=bup+(15*Point);
         //ObjectDelete ("myx"+DoubleToStr(objtick,0));
         //ObjectCreate ("myx"+DoubleToStr(objtick,0), OBJ_TEXT, 0, Time[i], High[i]+(7*Point));
         //ObjectSetText("myx"+DoubleToStr(objtick,0),"X",15,"Arial",Red);
         //objtick++;
        }
      if( Low[i]<=bdn-(14*Point) )
        {
         val1[i]=bdn-(15*Point);
         //ObjectDelete ("myx"+DoubleToStr(objtick,0));
         //ObjectCreate ("myx"+DoubleToStr(objtick,0), OBJ_TEXT, 0, Time[i], High[i]+(7*Point));
         //ObjectSetText("myx"+DoubleToStr(objtick,0),"X",15,"Arial",Red);
         //objtick++;
        }

     }//for

   //Comment(DoubleToStr(mybars,0)+" bars with usable ="+DoubleToStr(objtick,0)+" and unusable="+DoubleToStr(noobj,0)+" maxTR="+DoubleToStr(maxTR,4));

  }//start
Sample
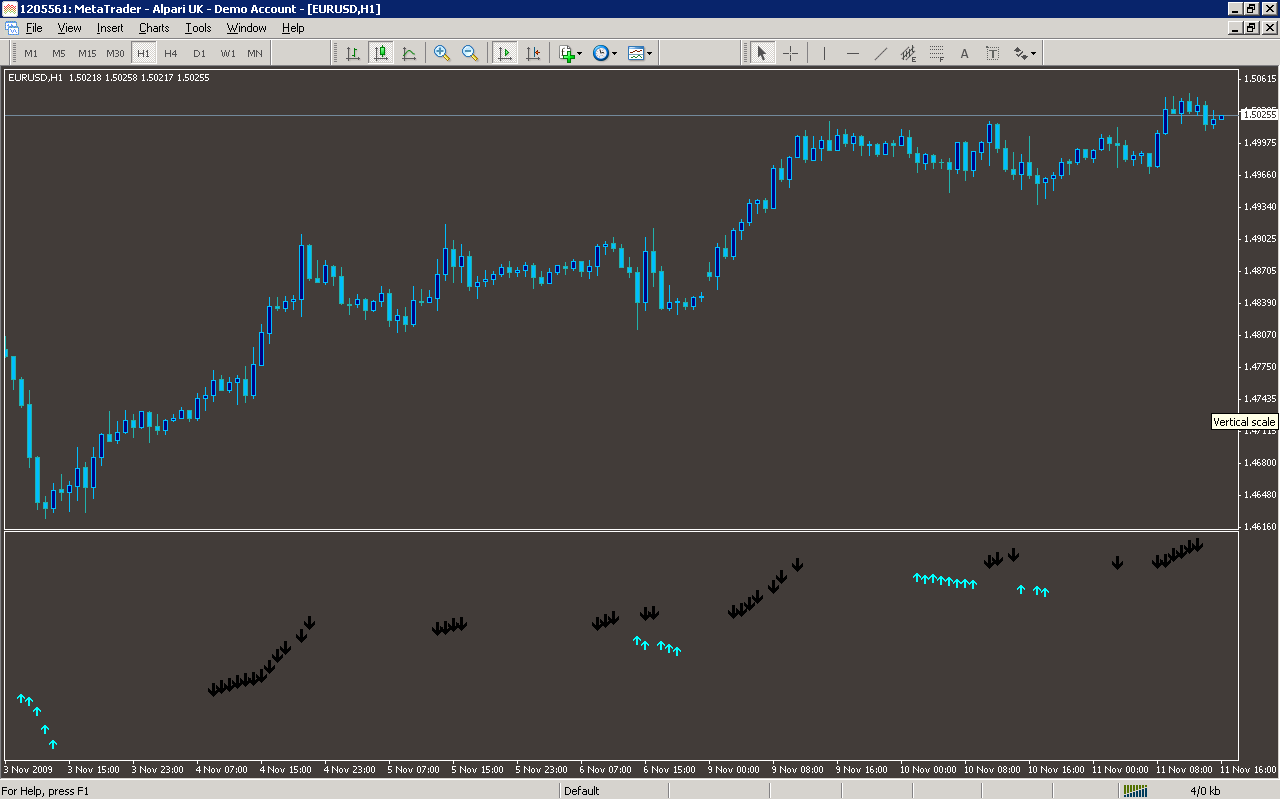
Analysis
Market Information Used:
Series array that contains the highest prices of each bar
Series array that contains the lowest prices of each bar
Indicator Curves created:
Implements a curve of type DRAW_ARROW
Indicators Used:
Bollinger bands indicator
Custom Indicators Used:
Order Management characteristics:
Other Features: