/*-----------------------------+
|			       |
| Shared by www.Aptrafx.com    |
|			       |
+------------------------------*/

//+------------------------------------------------------------------+
//|                                                     #MTF_ATR.mq4 |
//|------------------------------------------------------------------+

#property indicator_separate_window
#property indicator_buffers 1
#property indicator_color1 HotPink

//---- input parameters
/*************************************************************************
PERIOD_M1   1
PERIOD_M5   5
PERIOD_M15  15
PERIOD_M30  30
PERIOD_H1   60
PERIOD_H4   240
PERIOD_D1   1440
PERIOD_W1   10080
PERIOD_MN1  43200
You must use the numeric value of the timeframe that you want to use
when you set the TimeFrame' value with the indicator inputs.
---------------------------------------*/

extern int    TimeFrame = 0;
extern int    Periods=12;

double ExtMapBuffer1[];

//+------------------------------------------------------------------+
//| Custom indicator initialization function                         |
//+------------------------------------------------------------------+

int init()
  {

//---- indicator line

   SetIndexStyle(0,DRAW_LINE,EMPTY,1);
   SetIndexBuffer(0,ExtMapBuffer1);

//---- name for DataWindow and indicator subwindow label

   switch(TimeFrame)
   {
      case 1 : string TimeFrameStr="Period_M1"; break;
      case 5 : TimeFrameStr="Period_M5"; break;
      case 15 : TimeFrameStr="Period_M15"; break;
      case 30 : TimeFrameStr="Period_M30"; break;
      case 60 : TimeFrameStr="Period_H1"; break;
      case 240 : TimeFrameStr="Period_H4"; break;
      case 1440 : TimeFrameStr="Period_D1"; break;
      case 10080 : TimeFrameStr="Period_W1"; break;
      case 43200 : TimeFrameStr="Period_MN1"; break;
      default : TimeFrameStr="Current Timeframe";
   }
   IndicatorShortName(" #MTF_ATR ( "+Periods+" ) ( "+TimeFrameStr+" ) ");

  }

//----

   return(0);

//+------------------------------------------------------------------+
//|                                                                  |
//+------------------------------------------------------------------+

int start()
  {

   datetime TimeArray[];
   int    i,limit,y=0,counted_bars=IndicatorCounted();

// Plot defined time frame on to current time frame

   ArrayCopySeries(TimeArray,MODE_TIME,Symbol(),TimeFrame);

   limit= Bars-1;
   for(i=0,y=0;i<limit;i++)
   {
   if (Time[i]<TimeArray[y]) y++;

/***********************************************************
   Add your main indicator loop below.  You can reference an existing
      indicator with its iName  or iCustom.
   Rule 1:  Add extern inputs above for all neccesary values
   Rule 2:  Use 'TimeFrame' for the indicator time frame
   Rule 3:  Use 'y' for your indicator's shift value
 **********************************************************/

   ExtMapBuffer1[i]=iATR(Symbol(),TimeFrame,Periods,y);

   }

   //FIX for display
//++++++++++++++++++++++++++++++++++++++++++++++++++++++++
   if (TimeFrame>Period()) {
     int PerINT=TimeFrame/Period()+1;
     datetime TimeArr[]; ArrayResize(TimeArr,PerINT);
     ArrayCopySeries(TimeArr,MODE_TIME,Symbol(),Period());
     for(i=0;i<PerINT+1;i++) {if (TimeArr[i]>=TimeArray[0]) {
//----
 /************************************************ by Raff
    Refresh buffers:         buffer[i] = buffer[0];
 ********************************************************/

   ExtMapBuffer1[i]=ExtMapBuffer1[0];


//----
   } } }
//+++++++++++++++++++++++++++++++++++++++++++++++++++
//END of fix

   return(0);
  }
//+------------------------------------------------------------------+
Sample
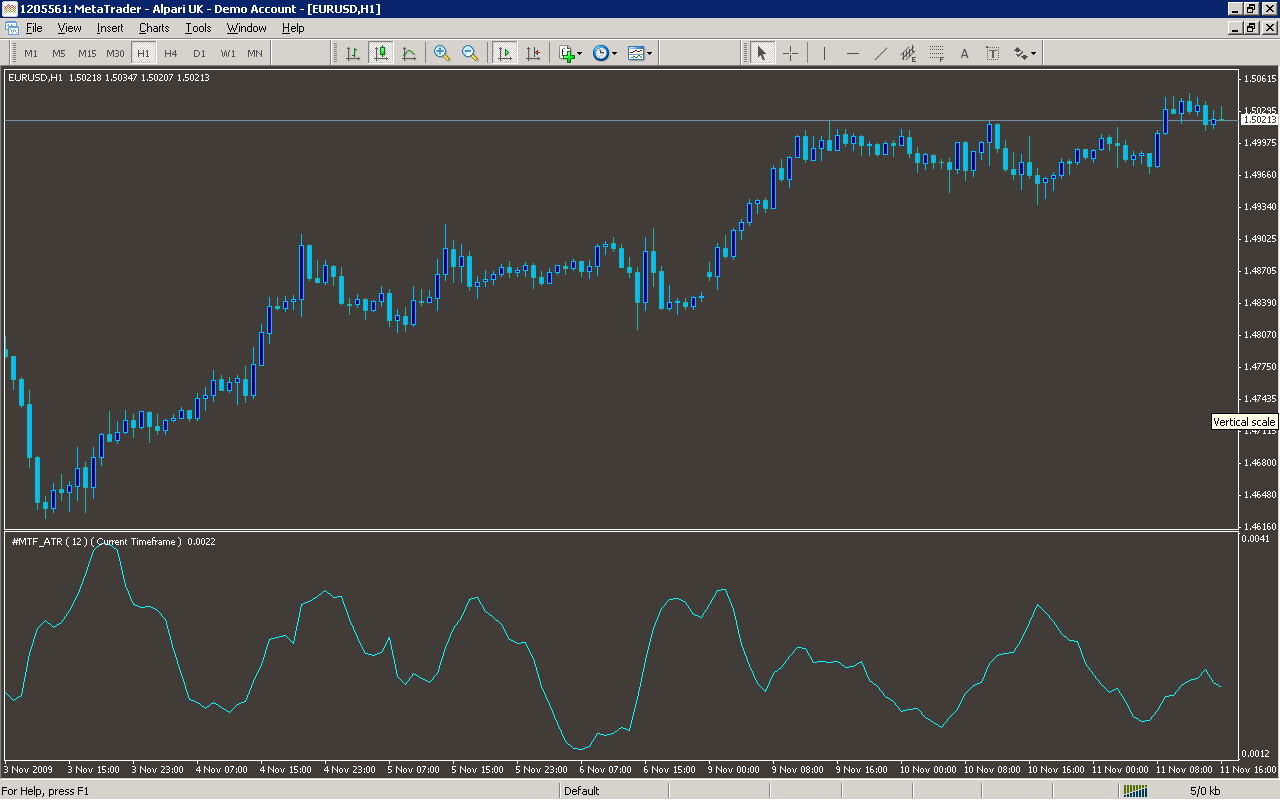
Analysis
Market Information Used:
Series array that contains open time of each bar
Indicator Curves created:
Implements a curve of type DRAW_LINE
Indicators Used:
Indicator of the average true range
Custom Indicators Used:
Order Management characteristics:
Other Features: