//+-------------------------------------------------------------------+
//|                                        _TRO_RANGE.mq4             |
//|                                                         TRO, 2007 |
//|                                modified by Skyline on 22 Nov 2007 |
//+-------------------------------------------------------------------+
#property  copyright "Copyright ? 2007, Avery T. Horton, Jr. aka TRO"
#property  link      "http://www.therumpldone.com/"
//---- indicator settings
#property  indicator_separate_window
#property  indicator_buffers 2
#property  indicator_color1  Red
#property  indicator_color2  Green
//---- indicator buffers
double     RANGEBuffer[];
double     RANGEBuffer1[];
//---- indicator parameters
extern int   Threshold=20;
extern color CurrentBarColor=White;
extern color ThresholdColor =Aqua;
//+------------------------------------------------------------------+
//| Custom indicator initialization function                         |
//+------------------------------------------------------------------+
int init()
  {
//---- drawing settings
   SetIndexStyle(0,DRAW_HISTOGRAM,STYLE_SOLID,2);
   SetIndexStyle(1,DRAW_HISTOGRAM,STYLE_SOLID,2);
//---- indicator buffers mapping
   SetIndexBuffer(0,RANGEBuffer);
   SetIndexBuffer(1,RANGEBuffer1);
//---- name for DataWindow and indicator subwindow label
   IndicatorShortName("RANGE");
   SetIndexLabel(0,"RANGE");
   SetIndexLabel(1,"RANGE");
//---- initialization done
   return(0);
  }
//+------------------------------------------------------------------+
//|                                                                  |
//+------------------------------------------------------------------+
int deinit()
  {
   ObjectDelete("CurrentBarValue");
   ObjectDelete("LabelCurrentBarValue");
  }
//+------------------------------------------------------------------+
//| Range                                                            |
//+------------------------------------------------------------------+
int start()
  {
   double HighVal,LowVal;
   int limit;
   int counted_bars=IndicatorCounted();
//---- last counted bar will be recounted
   if(counted_bars>0) counted_bars--;
   limit=Bars-counted_bars;
//---- RANGE counted in the 1-st buffer
   for(int i=0; i<limit; i++)
     {
      HighVal =iHigh(NULL,0,i);
      LowVal  =iLow(NULL,0,i);
      if ((HighVal-LowVal)/Point>=Threshold) { RANGEBuffer1[i]=(HighVal-LowVal)/Point; }
      else { RANGEBuffer[i]=(HighVal-LowVal)/Point; }
      // Draw Threshold line
      int win_idx=WindowFind("RANGE");
/*
     ObjectDelete("Threshold");
     ObjectCreate("Threshold", OBJ_HLINE, win_idx, Time[0], Threshold);
     ObjectSet("Threshold", OBJPROP_COLOR, ThresholdColor);
     ObjectSet("Threshold", OBJPROP_STYLE, STYLE_SOLID);
     ObjectSet("Threshold", OBJPROP_WIDTH, 1);
     ObjectSet("Threshold", OBJPROP_BACK, true);
      Label for Threshold
     ObjectDelete("LabelThreshold");
     ObjectCreate("LabelThreshold", OBJ_TEXT, win_idx, Time[0], Threshold);
     ObjectSet("LabelThreshold", OBJPROP_COLOR, ThresholdColor);
     ObjectSetText("LabelThreshold", "Threshold",8);
     ObjectSet("LabelThreshold", OBJPROP_ANGLE, 0);
*/
      // Draw Current Bar line value
      ObjectDelete("CurrentBarValue");
      ObjectCreate("CurrentBarValue", OBJ_HLINE, win_idx, Time[0], (iHigh(NULL,0,0)-iLow(NULL,0,0))/Point);
      ObjectSet("CurrentBarValue", OBJPROP_COLOR, CurrentBarColor);
      ObjectSet("CurrentBarValue", OBJPROP_STYLE, STYLE_SOLID);
      ObjectSet("CurrentBarValue", OBJPROP_WIDTH, 1);
      ObjectSet("CurrentBarValue", OBJPROP_BACK, true);
      // Label per Current Bar Line
      // ObjectDelete("LabelCurrentBarValue");
      // ObjectCreate("LabelCurrentBarValue", OBJ_TEXT, win_idx, Time[0], (iHigh(NULL,0,0)-iLow(NULL,0,0))/Point);
      ObjectSet("LabelCurrentBarValue", OBJPROP_COLOR, CurrentBarColor);
      ObjectSetText("LabelCurrentBarValue", "Current Bar value",8);
      ObjectSet("LabelCurrentBarValue", OBJPROP_ANGLE, 0);
     }
//---- done
   return(0);
  }
//------------------------------------------------------------------+
Sample
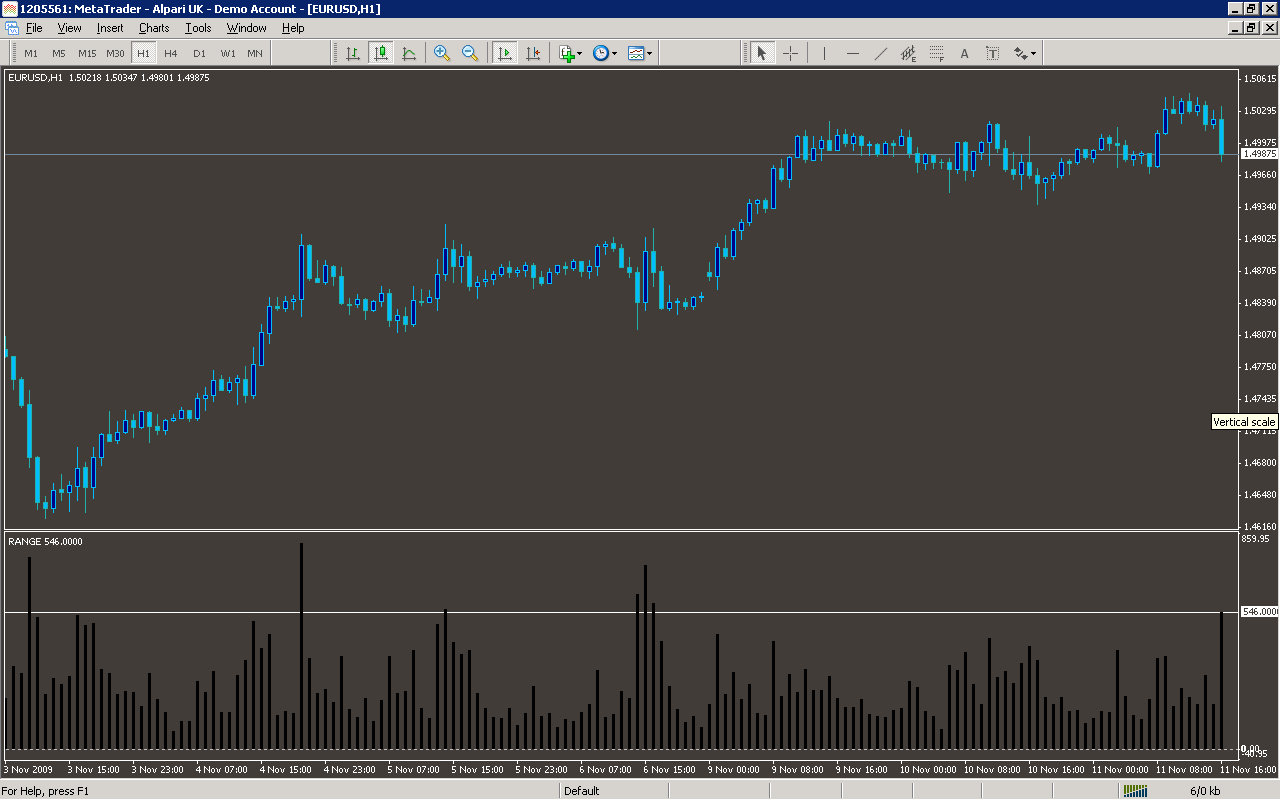
Analysis
Market Information Used:
Series array that contains the highest prices of each bar
Series array that contains the lowest prices of each bar
Series array that contains open time of each bar
Indicator Curves created:
Implements a curve of type DRAW_HISTOGRAM
Indicators Used:
Custom Indicators Used:
Order Management characteristics:
Other Features: