//+------------------------------------------------------------------+
//|                                     ATM_Pure_WPR_Alert v2.mq4    |
//|                      Copyright © 2005, MetaQuotes Software Corp. |
//|                                       http://www.metaquotes.net/ |
//|   DME  July 20, 2009  Dropped line plot, added colored dots for
//|                       over sold / over bought conditions.
//+------------------------------------------------------------------+
#property copyright "Copyright © 2005, MetaQuotes Software Corp."
#property link      "http://www.metaquotes.net/"
//----
#property indicator_separate_window
#property indicator_minimum -95
#property indicator_maximum -5
#property indicator_buffers 3
#property indicator_style1 DRAW_ARROW
#property indicator_style2 DRAW_ARROW
#property indicator_color1 Maroon
#property indicator_color2 MidnightBlue
#property indicator_color3 WhiteSmoke
#property indicator_width1 0
#property indicator_width2 0


//---- input parameters
extern int ExtWPRPeriod = 50;
extern string note = "turn on Alert = true; turn off = false";
extern bool AlertOn = true;
extern int       BullLevel=-92;
extern int       BearLevel=-8;
//---- buffers
double ExtWPRBuffer[];
double UpBuffer[];
double DnBuffer[];

// Show regular timeframe string (HCY)
string AlertPrefix;
string GetTimeFrameStr() {
   switch(Period())
   {
      case 1 : string TimeFrameStr="M1"; break;
      case 5 : TimeFrameStr="M5"; break;
      case 15 : TimeFrameStr="M15"; break;
      case 30 : TimeFrameStr="M30"; break;
      case 60 : TimeFrameStr="H1"; break;
      case 240 : TimeFrameStr="H4"; break;
      case 1440 : TimeFrameStr="D1"; break;
      case 10080 : TimeFrameStr="W1"; break;
      case 43200 : TimeFrameStr="MN1"; break;
      default : TimeFrameStr="CUR";
   }
   return (TimeFrameStr);
   }
//+------------------------------------------------------------------+
//| Custom indicator initialization function                         |
//+------------------------------------------------------------------+
int init()
  {
   string sShortName;
//---- indicator buffer mapping
   SetIndexStyle(0, DRAW_ARROW, STYLE_SOLID, 0);
   SetIndexBuffer(0,UpBuffer);
   SetIndexArrow(0,108);         //234   241
   SetIndexStyle(1, DRAW_ARROW, STYLE_SOLID, 0);
   SetIndexBuffer(1,DnBuffer);
   SetIndexArrow(1,108);          //233    242
   SetIndexBuffer(2, ExtWPRBuffer);

//---- indicator line
   SetIndexStyle(3, DRAW_LINE);

//---- name for DataWindow and indicator subwindow label
   sShortName="%R(" + ExtWPRPeriod + ")";
   IndicatorShortName(sShortName);
   SetIndexLabel(0, sShortName);
//---- first values aren't drawn
   SetIndexDrawBegin(3, ExtWPRPeriod);
//----
   AlertPrefix=Symbol()+" ("+GetTimeFrameStr()+"):  ";
   return(0);
  }
//+------------------------------------------------------------------+
//| Williams’ Percent Range                                          |
//+------------------------------------------------------------------+
int start()
  {
   int i, nLimit, nCountedBars;
   double WPR;
//---- insufficient data
   if(Bars <= ExtWPRPeriod)
       return(0);
//---- bars count that does not changed after last indicator launch.
   nCountedBars = IndicatorCounted();
//----Williams’ Percent Range calculation
   i = Bars - ExtWPRPeriod - 1;
   if(nCountedBars > ExtWPRPeriod)
       i = Bars - nCountedBars - 1;
   while(i >= 0)
     {
       double dMaxHigh = High[Highest(NULL, 0, MODE_HIGH, ExtWPRPeriod, i)];
       double dMinLow  = Low[Lowest(NULL, 0, MODE_LOW, ExtWPRPeriod, i)];
       if(!CompareDouble((dMaxHigh - dMinLow), 0.0))
           WPR = -100*(dMaxHigh - Close[i]) / (dMaxHigh - dMinLow);
   //        ExBuffer[i] = 1;

//        UpBuffer[i+1]=  EMPTY_VALUE;  //  UpDnZero;
//  	    DnBuffer[i+1]=  EMPTY_VALUE;  //  UpDnZero;

       if(WPR >= BearLevel)    {  DnBuffer[i]= BearLevel;  }
	    if(WPR <= BullLevel)    {  UpBuffer[i]= BullLevel;  }

       i--;
     }


//----
   // ======= Alert =========
   if(AlertOn && NewBar()){
      if((WPR <= BullLevel) && (WPR <=-indicator_minimum))
         Alert(Symbol()+" M"+Period()+": ATM WPR Lower Dots");
      else
      if((WPR >= BearLevel) && (WPR <=indicator_maximum))
         Alert(Symbol()+" M"+Period()+": ATM WPR Upper Dots");
      }
   // ======= Alert Ends =========


   return(0);
  }


//+------------------------------------------------------------------+
//| Ôóíêöèÿ ñðàíåíèÿ äâóõ âåùåñòâåííûõ ÷èñåë.                        |
//+------------------------------------------------------------------+
bool CompareDouble(double Number1, double Number2)
  {
    bool Compare = NormalizeDouble(Number1 - Number2, 8) == 0;
    return(Compare);
  }
//+------------------------------------------------------------------+
bool NewBar()
{
   static datetime lastbar;
   datetime curbar = Time[0];
   //Print("NewBar(). lastbar="+TimeToStr(lastbar,TIME_DATE|TIME_MINUTES)+"  curbar="+TimeToStr(curbar,TIME_DATE|TIME_MINUTES));
   if(lastbar!=curbar)
   {
      lastbar=curbar;
      return (true);
   }
   else
   {
      return(false);
   }
}
Sample
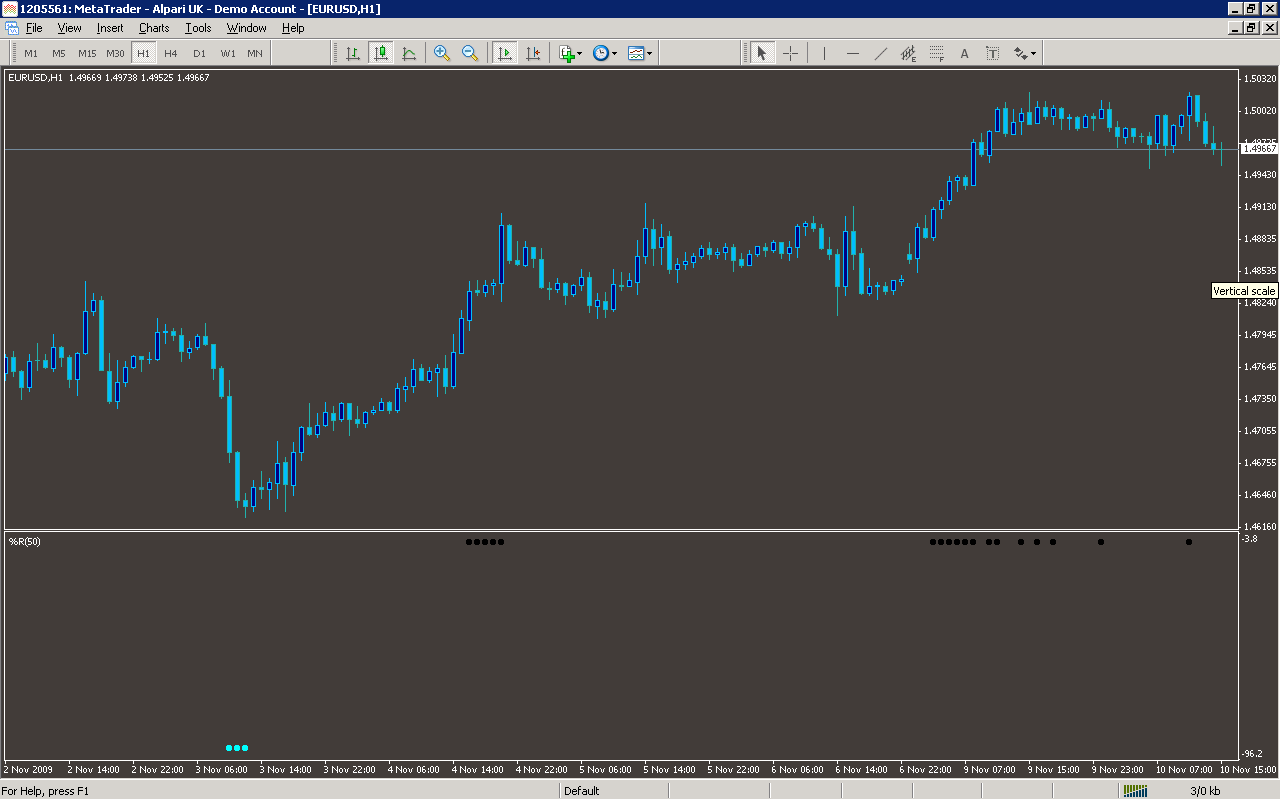
Analysis
Market Information Used:
Series array that contains the highest prices of each bar
Series array that contains the lowest prices of each bar
Series array that contains close prices for each bar
Series array that contains open time of each bar
Indicator Curves created:
Implements a curve of type DRAW_ARROW
Implements a curve of type DRAW_LINE
Indicators Used:
Custom Indicators Used:
Order Management characteristics:
Other Features:
It issuies visual alerts to the screen