//+------------------------------------------------------------------+
//|                                                          ATR.mq4 |
//|                      Copyright © 2005, MetaQuotes Software Corp. |
//|                                       http://www.metaquotes.net/ |
//+------------------------------------------------------------------+
#property copyright "Copyright © 2005, MetaQuotes Software Corp."
#property link      "http://www.metaquotes.net/"

#property indicator_separate_window
#property indicator_buffers 1
#property indicator_color1 DodgerBlue
//---- input parameters
extern int AtrPeriod=14;
//---- buffers
double AtrBuffer[];
double TempBuffer[];
//+------------------------------------------------------------------+
//| Custom indicator initialization function                         |
//+------------------------------------------------------------------+
int init()
  {
   string short_name;
//---- 1 additional buffer used for counting.
   IndicatorBuffers(2);
//---- indicator line
   SetIndexStyle(0,DRAW_LINE);
   SetIndexBuffer(0,AtrBuffer);
   SetIndexBuffer(1,TempBuffer);
//---- name for DataWindow and indicator subwindow label
   short_name="ATR("+AtrPeriod+")";
   IndicatorShortName(short_name);
   SetIndexLabel(0,short_name);
//----
   SetIndexDrawBegin(0,AtrPeriod);
//----
   return(0);
  }
//+------------------------------------------------------------------+
//| Average True Range                                               |
//+------------------------------------------------------------------+
int start()
  {
   int i,counted_bars=IndicatorCounted();
//----
   if(Bars<=AtrPeriod) return(0);
//---- initial zero
   if(counted_bars<1)
      for(i=1;i<=AtrPeriod;i++) AtrBuffer[Bars-i]=0.0;
//----
   i=Bars-counted_bars-1;
   while(i>=0)
     {
      double high=High[i];
      double low =Low[i];
      if(i==Bars-1) TempBuffer[i]=high-low;
      else
        {
         double prevclose=Close[i+1];
         TempBuffer[i]=MathMax(high,prevclose)-MathMin(low,prevclose);
        }
      i--;
     }
//----
   if(counted_bars>0) counted_bars--;
   int limit=Bars-counted_bars;
   for(i=0; i<limit; i++)
      AtrBuffer[i]=iMAOnArray(TempBuffer,Bars,AtrPeriod,0,MODE_SMA,i);
//----
   return(0);
  }
//+------------------------------------------------------------------+
Sample
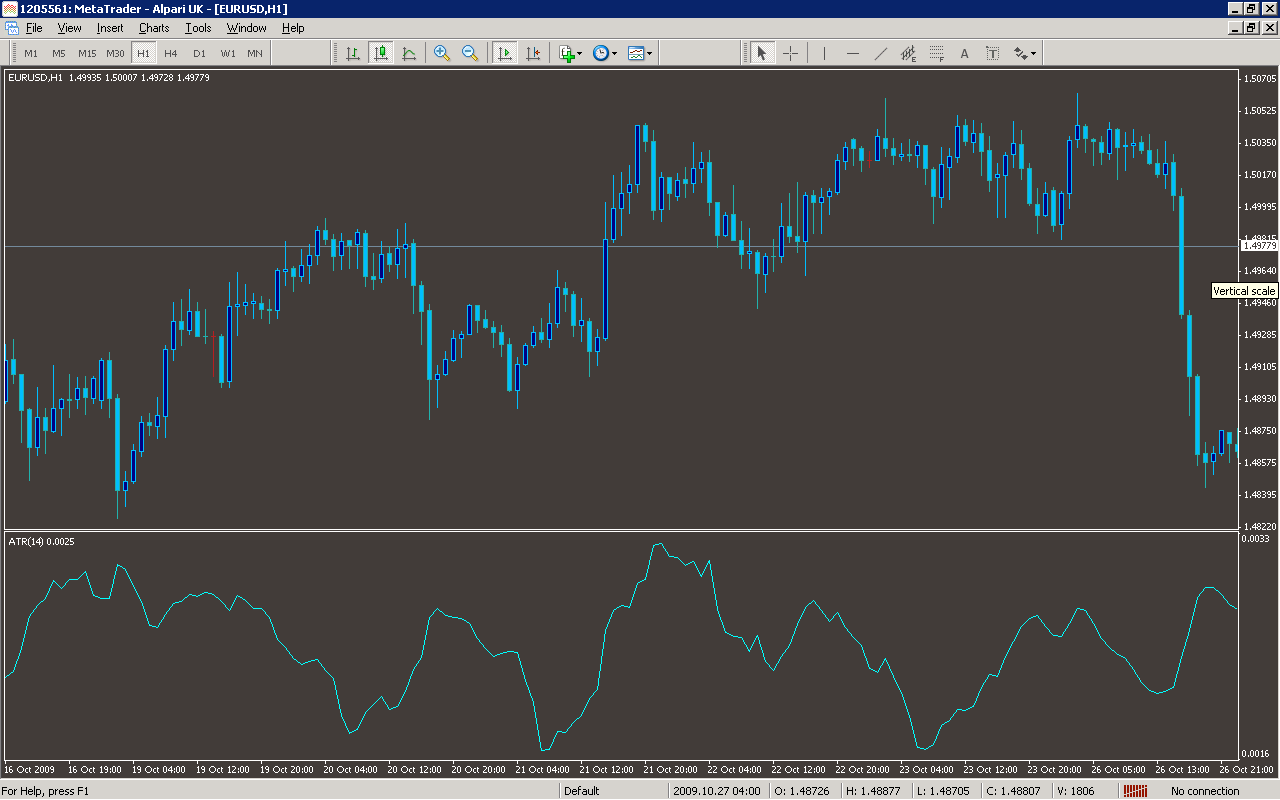
Analysis
Market Information Used:
Series array that contains the highest prices of each bar
Series array that contains the lowest prices of each bar
Series array that contains close prices for each bar
Indicator Curves created:
Implements a curve of type DRAW_LINE
Indicators Used:
Moving average indicator
Custom Indicators Used:
Order Management characteristics:
Other Features: