//+------------------------------------------------------------------+
//|                                             Accumulation&2MA.mq4 |
//|                      Copyright © 2006, MetaQuotes Software Corp. |
//|                          only modified by lukas1                 |
//+------------------------------------------------------------------+
#property copyright "Copyright © 2006, MetaQuotes + lukas1"
#property link      "http://www.metaquotes.net/"

#property indicator_separate_window
#property indicator_buffers 3
#property indicator_color1 LightSeaGreen
#property indicator_color2 Red
#property indicator_color3 Blue
//---- buffers
extern int FMA=3;
extern int SMA=10;
double ExtMapBuffer1[];
double SignalBuffer1[];
double SignalBuffer2[];
//+------------------------------------------------------------------+
//| Custom indicator initialization function                         |
//+------------------------------------------------------------------+
int init()
  {
   IndicatorShortName("A/D");
//---- indicators
   SetIndexStyle(0,DRAW_LINE);
   SetIndexBuffer(0,ExtMapBuffer1);
   SetIndexStyle(1,DRAW_LINE,0,2);
   SetIndexBuffer(1,SignalBuffer1);
   SetIndexStyle(2,DRAW_LINE,0,2);
   SetIndexBuffer(2,SignalBuffer2);
//----
   return(0);
  }
//+------------------------------------------------------------------+
//| Accumulation/Distribution                                        |
//+------------------------------------------------------------------+
int start()
  {
   int i,limit,counted_bars=IndicatorCounted();
   limit=(Bars-counted_bars);
//----
   i=Bars-counted_bars-1;
   while(i>=0)
     {
      double high =High[i];
      double low  =Low[i];
      double open =Open[i];
      double close=Close[i];
      ExtMapBuffer1[i]=(close-low)-(high-close);//2close+high-low
      if(ExtMapBuffer1[i]!=0)
        {
         double diff=high-low;
         if(0==diff)
            ExtMapBuffer1[i]=0;
         else
           {
            ExtMapBuffer1[i]/=diff;
            ExtMapBuffer1[i]*=Volume[i];
           }
        }
      if(i<Bars-1) ExtMapBuffer1[i]+=ExtMapBuffer1[i+1];
      i--;
     }
   for(i=0; i<limit; i++)
      SignalBuffer1[i]=iMAOnArray(ExtMapBuffer1,Bars,FMA,0,MODE_EMA,i);
   for(i=0; i<limit; i++)
      SignalBuffer2[i]=iMAOnArray(ExtMapBuffer1,Bars,SMA,0,MODE_EMA,i);
//----
   return(0);
  }
//+------------------------------------------------------------------+
Sample
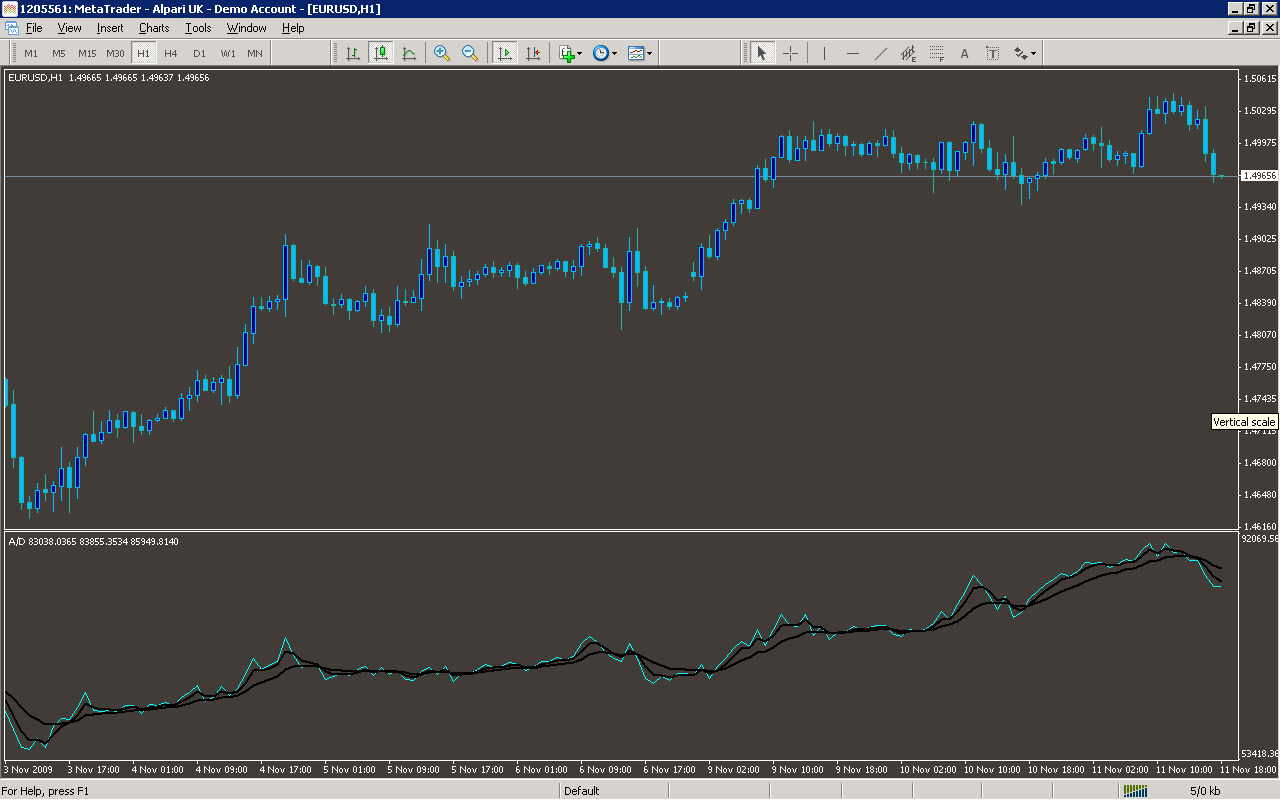
Analysis
Market Information Used:
Series array that contains the highest prices of each bar
Series array that contains the lowest prices of each bar
Series array that contains open prices of each bar
Series array that contains close prices for each bar
Series array that contains tick volumes of each bar
Indicator Curves created:
Implements a curve of type DRAW_LINE
Indicators Used:
Moving average indicator
Custom Indicators Used:
Order Management characteristics:
Other Features: