//+------------------------------------------------------------------+
//| AltrTrend.mq4
//| Ramdass - Conversion only
//+------------------------------------------------------------------+
#property  copyright "Author - OlegVS, GOODMAN"

#property indicator_chart_window
#property indicator_buffers 2
#property indicator_color1 Green
#property indicator_color2 Crimson


//---- input parameters
extern int K=30;
extern double Kstop=0.5;
extern int Kperiod=150;
extern int PerADX=14;
extern int CountBars=350;

//---- buffers
double val1[];
double val2[];

/* *************************************************
// Code for using in expert

extern string  fi="--Altr Trend Settings--";
extern int K=30;
extern double Kstop=0.5;
extern int Kperiod=150;
extern int PerADX=14;
extern int SignalTimeFrame = 60;

bool CheckAltrTrend(int cmd)
{
   double val1, val2;

// Get the 2 buffer values

   val1 = iCustom(NULL, Signal_TimeFrame, "AltrTrend",K, Kstop, KPeriod, PerADX, 0,1);
   val2 = iCustom(NULL, Signal_TimeFrame, "AltrTrend",K, Kstop, KPeriod, PerADX, 1,1);

   if (val1 > 0 && val2 > 0)
   {
   switch (cmd)
   {
     case OP_BUY : if (val1 > val2) // Check for Green
                   {
                         return (true);
                   }
                   break;
     case OP_SELL : if (val1 < val2) // Check for Red
                    {
                         return (true);
                    }
   }
   }

   return(false);
}
******************************************* */

//+------------------------------------------------------------------+
//| Custom indicator initialization function                         |
//+------------------------------------------------------------------+
int init()
  {
   string short_name;
//---- indicator line
   IndicatorBuffers(4);
   SetIndexStyle(0,DRAW_HISTOGRAM,0,2);
   SetIndexStyle(1,DRAW_HISTOGRAM,0,2);
   SetIndexStyle(2,DRAW_HISTOGRAM,0,2);
   SetIndexStyle(3,DRAW_HISTOGRAM,0,2);
   SetIndexBuffer(0,val1);
   SetIndexBuffer(1,val2);
//----
   return(0);
  }
//+------------------------------------------------------------------+
//| AltrTrend                                                        |
//+------------------------------------------------------------------+
int start()
  {
   if (CountBars>=Bars) CountBars=Bars;
   SetIndexDrawBegin(0,Bars-CountBars+PerADX);
   SetIndexDrawBegin(1,Bars-CountBars+PerADX);
   int i,shift,counted_bars=IndicatorCounted();
   int i1,i2,x1=70,x2=30;
   double Range,AvgRange,smin,smax,SsMax,SsMin,SSP,price;
//----
   if(Bars<=PerADX+1) return(0);
//---- initial zero
   if(counted_bars<SSP+1)
   {
      for(i=1;i<=PerADX;i++) val1[CountBars-i]=0.0;
      for(i=1;i<=PerADX;i++) val2[CountBars-i]=0.0;
   }
//----


for (shift = CountBars-PerADX; shift>=0; shift--)
{

SSP=MathCeil(Kperiod/iADX(NULL,0,PerADX,PRICE_CLOSE,MODE_MAIN,1));
	Range=0;
	AvgRange=0;
	for (i1=shift; i1<=shift+SSP; i1++)
		{AvgRange=AvgRange+MathAbs(High[i1]-Low[i1]);
		}
	Range=AvgRange/(SSP+1);

SsMax=High[shift]; SsMin=Low[shift];
   for (i2=shift;i2<=shift+SSP-1;i2++)
        {
         price=High[i2];
         if(SsMax<price) SsMax=price;
         price=Low[i2];
         if(SsMin>=price)  SsMin=price;
        }

smin = SsMin+(SsMax-SsMin)*K/100;
smax = SsMax-(SsMax-SsMin)*K/100;
	val1[shift]=0;
	val2[shift]=0;
	if (Close[shift]<smin)
		{
		val1[shift]=Low[shift]; val2[shift]=High[shift];
		}
	if (Close[shift]>smax)
		{
		val1[shift]=High[shift]; val2[shift]=Low[shift];
		}

}
   return(0);
  }
//+------------------------------------------------------------------+
Sample
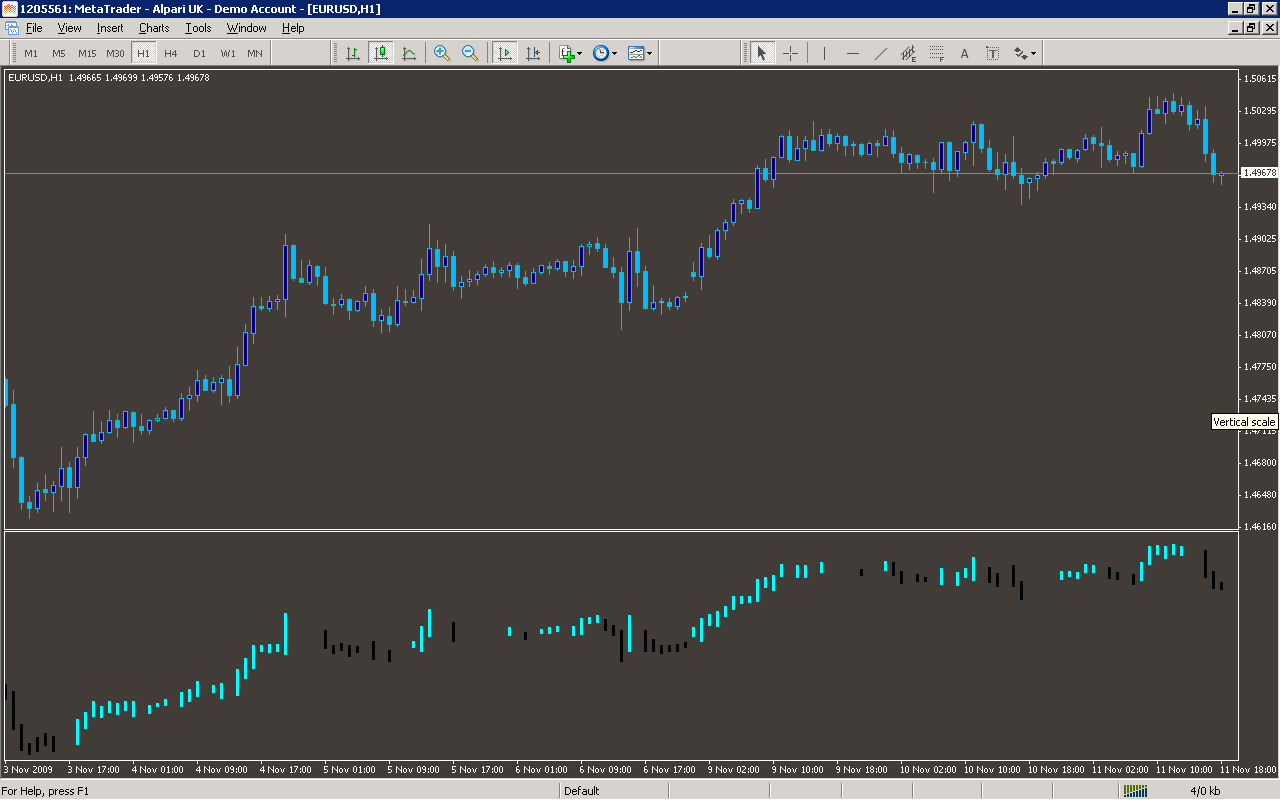
Analysis
Market Information Used:
Series array that contains the highest prices of each bar
Series array that contains the lowest prices of each bar
Series array that contains close prices for each bar
Indicator Curves created:
Implements a curve of type DRAW_HISTOGRAM
Indicators Used:
Movement directional index
Custom Indicators Used:
AltrTrend
Order Management characteristics:
Other Features: