Strategy Tester Report
AlpariUK-Demo (Build 225)
| Symbol | EURUSD (Euro vs US Dollar) | ||||
| Period | 1 Hour (H1) 2009.12.01 00:00 - 2010.01.15 22:00 (2009.12.01 - 2010.01.17) | ||||
| Model | Control points (a very crude method, the results must not be considered) | ||||
| Parameters | DMILevels=25; ADXLevel=15; lots=0.1; StopLoss=60; Slippage=4; | ||||
| Bars in test | 1753 | Ticks modelled | 19953 | Modelling quality | n/a |
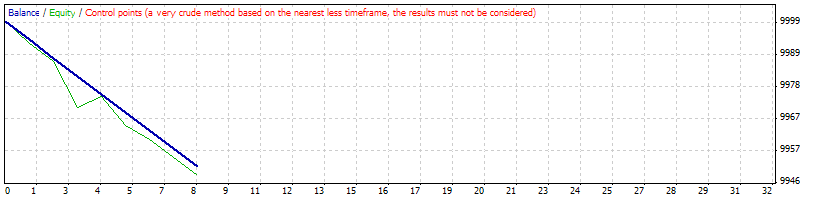
| Mismatched charts errors | 1 | ||||
| Initial deposit | 10000.00 | ||||
| Total net profit | -48.51 | Gross profit | 0.00 | Gross loss | -48.51 |
| Profit factor | 0.00 | Expected payoff | -6.06 | ||
| Absolute drawdown | 48.51 | Maximal drawdown | 97.40 (0.97%) | Relative drawdown | 0.97% (97.40) |
| Total trades | 8 | Short positions (won %) | 5 (0.00%) | Long positions (won %) | 3 (0.00%) |
| Profit trades (% of total) | 0 (0.00%) | Loss trades (% of total) | 8 (100.00%) | ||
| Largest | profit trade | 0.00 | loss trade | -6.51 | |
| Average | profit trade | 0.00 | loss trade | -6.06 | |
| Maximum | consecutive wins (profit in money) | 0 (0.00) | consecutive losses (loss in money) | 8 (-48.51) | |
| Maximal | consecutive profit (count of wins) | 0.00 (0) | consecutive loss (count of losses) | -48.51 (8) | |
| Average | consecutive wins | 0 | consecutive losses | 8 | |
| # | Time | Type | Order | Size | Price | S / L | T / P | Profit | Balance |
| 1 | 2009.12.02 18:00 | sell | 1 | 0.10 | 1.50580 | 1.50640 | 0.00000 | ||
| 2 | 2009.12.02 18:02 | s/l | 1 | 0.10 | 1.50640 | 1.50640 | 0.00000 | -6.00 | 9994.00 |
| 3 | 2009.12.02 18:02 | sell | 2 | 0.10 | 1.50644 | 1.50704 | 0.00000 | ||
| 4 | 2009.12.03 00:40 | s/l | 2 | 0.10 | 1.50704 | 1.50704 | 0.00000 | -6.51 | 9987.49 |
| 5 | 2009.12.03 03:00 | buy | 3 | 0.10 | 1.50794 | 1.50734 | 0.00000 | ||
| 6 | 2009.12.03 15:20 | s/l | 3 | 0.10 | 1.50734 | 1.50734 | 0.00000 | -6.00 | 9981.49 |
| 7 | 2009.12.29 02:00 | sell | 4 | 0.10 | 1.43616 | 1.43676 | 0.00000 | ||
| 8 | 2009.12.29 05:20 | s/l | 4 | 0.10 | 1.43676 | 1.43676 | 0.00000 | -6.00 | 9975.49 |
| 9 | 2009.12.30 09:00 | buy | 5 | 0.10 | 1.43558 | 1.43498 | 0.00000 | ||
| 10 | 2009.12.30 09:15 | s/l | 5 | 0.10 | 1.43498 | 1.43498 | 0.00000 | -6.00 | 9969.49 |
| 11 | 2009.12.31 17:00 | sell | 6 | 0.10 | 1.43465 | 1.43525 | 0.00000 | ||
| 12 | 2009.12.31 17:32 | s/l | 6 | 0.10 | 1.43525 | 1.43525 | 0.00000 | -6.00 | 9963.49 |
| 13 | 2010.01.06 18:00 | buy | 7 | 0.10 | 1.44031 | 1.43971 | 0.00000 | ||
| 14 | 2010.01.06 18:15 | s/l | 7 | 0.10 | 1.43971 | 1.43971 | 0.00000 | -6.00 | 9957.49 |
| 15 | 2010.01.12 02:00 | sell | 8 | 0.10 | 1.44885 | 1.44945 | 0.00000 | ||
| 16 | 2010.01.12 02:20 | s/l | 8 | 0.10 | 1.44945 | 1.44945 | 0.00000 | -6.00 | 9951.49 |