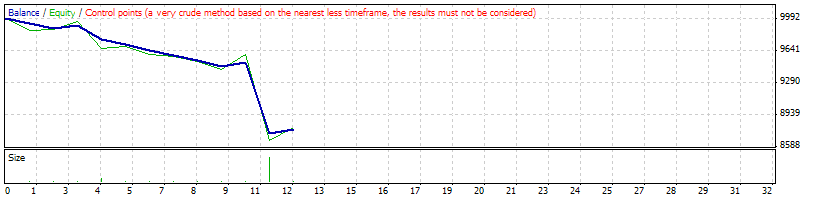
Strategy Tester Report
AlpariUK-Demo (Build 225)
| Symbol | EURUSD (Euro vs US Dollar) | ||||
| Period | 1 Hour (H1) 2009.12.01 00:00 - 2010.01.15 22:00 (2009.12.01 - 2010.01.17) | ||||
| Model | Control points (a very crude method, the results must not be considered) | ||||
| Parameters | p=10; tp=50; sl=50; lots=1; losseslimit=1000000; fastoptimize=false; mn=888; | ||||
| Bars in test | 1753 | Ticks modelled | 19953 | Modelling quality | n/a |
| Mismatched charts errors | 1 | ||||
| Initial deposit | 10000.00 | ||||
| Total net profit | -1221.92 | Gross profit | 126.00 | Gross loss | -1347.92 |
| Profit factor | 0.09 | Expected payoff | -101.83 | ||
| Absolute drawdown | 1291.92 | Maximal drawdown | 1330.92 (13.26%) | Relative drawdown | 13.26% (1330.92) |
| Total trades | 12 | Short positions (won %) | 3 (0.00%) | Long positions (won %) | 9 (33.33%) |
| Profit trades (% of total) | 3 (25.00%) | Loss trades (% of total) | 9 (75.00%) | ||
| Largest | profit trade | 42.00 | loss trade | -781.84 | |
| Average | profit trade | 42.00 | loss trade | -149.77 | |
| Maximum | consecutive wins (profit in money) | 1 (42.00) | consecutive losses (loss in money) | 6 (-450.08) | |
| Maximal | consecutive profit (count of wins) | 42.00 (1) | consecutive loss (count of losses) | -781.84 (1) | |
| Average | consecutive wins | 1 | consecutive losses | 3 | |
| # | Time | Type | Order | Size | Price | S / L | T / P | Profit | Balance |
| 1 | 2009.12.01 00:00 | sell | 1 | 1.00 | 1.50074 | 1.50132 | 1.50032 | ||
| 2 | 2009.12.01 00:33 | s/l | 1 | 1.00 | 1.50132 | 1.50132 | 1.50032 | -58.00 | 9942.00 |
| 3 | 2009.12.01 01:00 | buy | 2 | 1.00 | 1.50353 | 1.50295 | 1.50395 | ||
| 4 | 2009.12.01 01:15 | s/l | 2 | 1.00 | 1.50295 | 1.50295 | 1.50395 | -58.00 | 9884.00 |
| 5 | 2009.12.01 02:00 | buy | 3 | 1.00 | 1.50101 | 1.50043 | 1.50143 | ||
| 6 | 2009.12.01 02:15 | t/p | 3 | 1.00 | 1.50143 | 1.50043 | 1.50143 | 42.00 | 9926.00 |
| 7 | 2009.12.01 03:00 | buy | 4 | 2.76 | 1.50165 | 1.50107 | 1.50207 | ||
| 8 | 2009.12.01 03:15 | s/l | 4 | 2.76 | 1.50107 | 1.50107 | 1.50207 | -160.08 | 9765.92 |
| 9 | 2009.12.01 04:00 | buy | 5 | 1.00 | 1.50164 | 1.50106 | 1.50206 | ||
| 10 | 2009.12.01 04:15 | s/l | 5 | 1.00 | 1.50106 | 1.50106 | 1.50206 | -58.00 | 9707.92 |
| 11 | 2009.12.01 05:00 | buy | 6 | 1.00 | 1.50146 | 1.50088 | 1.50188 | ||
| 12 | 2009.12.01 05:02 | s/l | 6 | 1.00 | 1.50088 | 1.50088 | 1.50188 | -58.00 | 9649.92 |
| 13 | 2009.12.01 06:00 | buy | 7 | 1.00 | 1.50110 | 1.50052 | 1.50152 | ||
| 14 | 2009.12.01 06:05 | s/l | 7 | 1.00 | 1.50052 | 1.50052 | 1.50152 | -58.00 | 9591.92 |
| 15 | 2009.12.01 07:00 | sell | 8 | 1.00 | 1.50001 | 1.50059 | 1.49959 | ||
| 16 | 2009.12.01 07:07 | s/l | 8 | 1.00 | 1.50059 | 1.50059 | 1.49959 | -58.00 | 9533.92 |
| 17 | 2009.12.01 08:00 | sell | 9 | 1.00 | 1.50198 | 1.50256 | 1.50156 | ||
| 18 | 2009.12.01 08:10 | s/l | 9 | 1.00 | 1.50256 | 1.50256 | 1.50156 | -58.00 | 9475.92 |
| 19 | 2009.12.01 09:00 | buy | 10 | 1.00 | 1.50275 | 1.50217 | 1.50317 | ||
| 20 | 2009.12.01 09:03 | t/p | 10 | 1.00 | 1.50317 | 1.50217 | 1.50317 | 42.00 | 9517.92 |
| 21 | 2009.12.01 10:00 | buy | 11 | 13.48 | 1.50685 | 1.50627 | 1.50727 | ||
| 22 | 2009.12.01 10:02 | s/l | 11 | 13.48 | 1.50627 | 1.50627 | 1.50727 | -781.84 | 8736.08 |
| 23 | 2009.12.01 11:00 | buy | 12 | 1.00 | 1.50616 | 1.50558 | 1.50658 | ||
| 24 | 2009.12.01 11:10 | t/p | 12 | 1.00 | 1.50658 | 1.50558 | 1.50658 | 42.00 | 8778.08 |