Strategy Tester Report
AlpariUK-Demo (Build 225)
| Symbol | EURUSD (Euro vs US Dollar) | ||||
| Period | 1 Hour (H1) 2009.12.01 00:00 - 2010.01.15 22:00 (2009.12.01 - 2010.01.17) | ||||
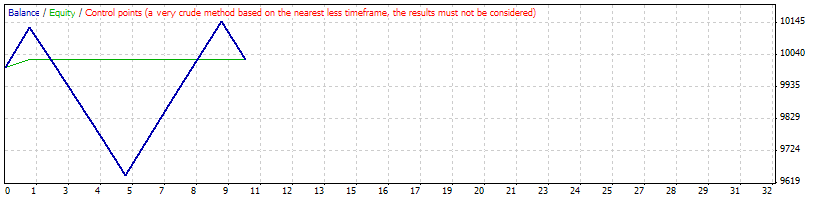
| Model | Control points (a very crude method, the results must not be considered) | ||||
| Parameters | Lots=0.02; maxcount=10; pipstep=50; quiescenow=false; donow=false; stopnow=false; closenow=false; use_sessionTP=false; sessionTP=1000; use_sessionSL=false; sessionSL=300; useinvalues=false; inmax=0; inmin=0; | ||||
| Bars in test | 1753 | Ticks modelled | 19953 | Modelling quality | n/a |
| Mismatched charts errors | 1 | ||||
| Initial deposit | 10000.00 | ||||
| Total net profit | 25.14 | Gross profit | 638.30 | Gross loss | -613.16 |
| Profit factor | 1.04 | Expected payoff | 2.51 | ||
| Absolute drawdown | 8.86 | Maximal drawdown | 10.40 (0.10%) | Relative drawdown | 0.10% (10.40) |
| Total trades | 10 | Short positions (won %) | 5 (100.00%) | Long positions (won %) | 5 (0.00%) |
| Profit trades (% of total) | 5 (50.00%) | Loss trades (% of total) | 5 (50.00%) | ||
| Largest | profit trade | 131.52 | loss trade | -125.53 | |
| Average | profit trade | 127.66 | loss trade | -122.63 | |
| Maximum | consecutive wins (profit in money) | 4 (506.78) | consecutive losses (loss in money) | 4 (-487.63) | |
| Maximal | consecutive profit (count of wins) | 506.78 (4) | consecutive loss (count of losses) | -487.63 (4) | |
| Average | consecutive wins | 3 | consecutive losses | 3 | |
| # | Time | Type | Order | Size | Price | S / L | T / P | Profit | Balance |
| 1 | 2009.12.01 00:02 | buy | 1 | 0.02 | 1.50129 | 0.00000 | 0.00000 | ||
| 2 | 2009.12.01 00:05 | sell | 2 | 0.02 | 1.50101 | 0.00000 | 0.00000 | ||
| 3 | 2009.12.01 00:36 | sell | 3 | 0.02 | 1.50169 | 0.00000 | 0.00000 | ||
| 4 | 2009.12.01 00:43 | sell | 4 | 0.02 | 1.50266 | 0.00000 | 0.00000 | ||
| 5 | 2009.12.01 00:50 | sell | 5 | 0.02 | 1.50330 | 0.00000 | 0.00000 | ||
| 6 | 2009.12.01 03:22 | buy | 6 | 0.02 | 1.50063 | 0.00000 | 0.00000 | ||
| 7 | 2009.12.01 06:12 | buy | 7 | 0.02 | 1.50021 | 0.00000 | 0.00000 | ||
| 8 | 2009.12.01 06:17 | buy | 8 | 0.02 | 1.49909 | 0.00000 | 0.00000 | ||
| 9 | 2009.12.01 06:22 | buy | 9 | 0.02 | 1.49798 | 0.00000 | 0.00000 | ||
| 10 | 2009.12.01 09:13 | sell | 10 | 0.02 | 1.50458 | 0.00000 | 0.00000 | ||
| 11 | 2010.01.15 22:57 | close at stop | 10 | 0.02 | 1.43863 | 0.00000 | 0.00000 | 131.52 | 10131.52 |
| 12 | 2010.01.15 22:57 | close at stop | 9 | 0.02 | 1.43843 | 0.00000 | 0.00000 | -118.91 | 10012.61 |
| 13 | 2010.01.15 22:57 | close at stop | 8 | 0.02 | 1.43843 | 0.00000 | 0.00000 | -121.13 | 9891.48 |
| 14 | 2010.01.15 22:57 | close at stop | 7 | 0.02 | 1.43843 | 0.00000 | 0.00000 | -123.37 | 9768.11 |
| 15 | 2010.01.15 22:57 | close at stop | 6 | 0.02 | 1.43843 | 0.00000 | 0.00000 | -124.21 | 9643.90 |
| 16 | 2010.01.15 22:57 | close at stop | 5 | 0.02 | 1.43863 | 0.00000 | 0.00000 | 128.96 | 9772.86 |
| 17 | 2010.01.15 22:57 | close at stop | 4 | 0.02 | 1.43863 | 0.00000 | 0.00000 | 127.68 | 9900.54 |
| 18 | 2010.01.15 22:57 | close at stop | 3 | 0.02 | 1.43863 | 0.00000 | 0.00000 | 125.74 | 10026.29 |
| 19 | 2010.01.15 22:57 | close at stop | 2 | 0.02 | 1.43863 | 0.00000 | 0.00000 | 124.38 | 10150.67 |
| 20 | 2010.01.15 22:57 | close at stop | 1 | 0.02 | 1.43843 | 0.00000 | 0.00000 | -125.53 | 10025.14 |