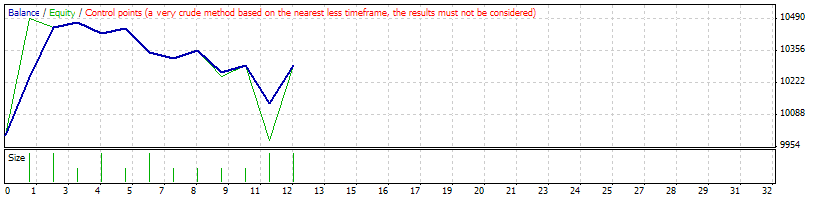
Strategy Tester Report
AlpariUK-Demo (Build 225)
| Symbol | EURUSD (Euro vs US Dollar) | ||||
| Period | 1 Hour (H1) 2009.12.01 00:00 - 2010.01.15 22:00 (2009.12.01 - 2010.01.17) | ||||
| Model | Control points (a very crude method, the results must not be considered) | ||||
| Parameters | Hours2Check=8; CloseHour=9; EarliestOpenHour=14; Days2Check=10; ChannelK=1.5; CheckHour_8=8; ProfitK_8=2; LossK_8=2; OffsetK_8=2; CheckHour_12=12; ProfitK_12=2; LossK_12=1.5; OffsetK_12=2.5; FilterDay=4; DoubleDay=5; UseMM=false; TradesPerDayAllowed=2; | ||||
| Bars in test | 1753 | Ticks modelled | 19953 | Modelling quality | n/a |
| Mismatched charts errors | 1 | ||||
| Initial deposit | 10000.00 | ||||
| Total net profit | 296.24 | Gross profit | 711.34 | Gross loss | -415.10 |
| Profit factor | 1.71 | Expected payoff | 24.69 | ||
| Absolute drawdown | 122.40 | Maximal drawdown | 729.06 (6.87%) | Relative drawdown | 6.87% (729.06) |
| Total trades | 12 | Short positions (won %) | 7 (57.14%) | Long positions (won %) | 5 (60.00%) |
| Profit trades (% of total) | 7 (58.33%) | Loss trades (% of total) | 5 (41.67%) | ||
| Largest | profit trade | 246.40 | loss trade | -157.80 | |
| Average | profit trade | 101.62 | loss trade | -83.02 | |
| Maximum | consecutive wins (profit in money) | 3 (473.46) | consecutive losses (loss in money) | 2 (-125.42) | |
| Maximal | consecutive profit (count of wins) | 473.46 (3) | consecutive loss (count of losses) | -157.80 (1) | |
| Average | consecutive wins | 1 | consecutive losses | 1 | |
| # | Time | Type | Order | Size | Price | S / L | T / P | Profit | Balance |
| 1 | 2009.12.04 16:00 | sell | 1 | 0.20 | 1.49491 | 1.50500 | 0.50000 | ||
| 2 | 2009.12.04 16:00 | sell | 2 | 0.20 | 1.49491 | 1.50900 | 0.50000 | ||
| 3 | 2009.12.04 21:00 | close | 1 | 0.20 | 1.48259 | 1.50500 | 0.50000 | 246.40 | 10246.40 |
| 4 | 2009.12.04 22:00 | close | 2 | 0.20 | 1.48459 | 1.50900 | 0.50000 | 206.40 | 10452.80 |
| 5 | 2009.12.08 17:00 | sell | 3 | 0.10 | 1.47357 | 1.48520 | 0.50000 | ||
| 6 | 2009.12.09 09:00 | close | 3 | 0.10 | 1.47150 | 1.48520 | 0.50000 | 20.66 | 10473.46 |
| 7 | 2009.12.11 16:00 | sell | 4 | 0.20 | 1.46533 | 1.47890 | 0.50000 | ||
| 8 | 2009.12.14 09:00 | close | 4 | 0.20 | 1.46747 | 1.47890 | 0.50000 | -42.88 | 10430.58 |
| 9 | 2009.12.15 15:00 | sell | 5 | 0.10 | 1.45393 | 1.46430 | 0.50000 | ||
| 10 | 2009.12.16 09:00 | close | 5 | 0.10 | 1.45193 | 1.46430 | 0.50000 | 19.96 | 10450.54 |
| 11 | 2009.12.18 17:00 | sell | 6 | 0.20 | 1.42737 | 1.44320 | 0.50000 | ||
| 12 | 2009.12.21 09:00 | close | 6 | 0.20 | 1.43247 | 1.44320 | 0.50000 | -102.08 | 10348.46 |
| 13 | 2009.12.22 17:00 | sell | 7 | 0.10 | 1.42309 | 1.43660 | 0.50000 | ||
| 14 | 2009.12.23 10:00 | close | 7 | 0.10 | 1.42542 | 1.43660 | 0.50000 | -23.34 | 10325.12 |
| 15 | 2009.12.23 17:00 | buy | 8 | 0.10 | 1.43339 | 1.42080 | 1.50000 | ||
| 16 | 2009.12.24 09:00 | close | 8 | 0.10 | 1.43648 | 1.42080 | 1.50000 | 30.96 | 10356.08 |
| 17 | 2009.12.29 14:00 | buy | 9 | 0.10 | 1.44500 | 1.43610 | 1.50000 | ||
| 18 | 2009.12.29 17:20 | s/l | 9 | 0.10 | 1.43610 | 1.43610 | 1.50000 | -89.00 | 10267.08 |
| 19 | 2010.01.04 15:00 | buy | 10 | 0.10 | 1.44236 | 1.43250 | 1.50000 | ||
| 20 | 2010.01.05 09:00 | close | 10 | 0.10 | 1.44517 | 1.43250 | 1.50000 | 28.12 | 10295.20 |
| 21 | 2010.01.08 15:00 | buy | 11 | 0.20 | 1.44037 | 1.42990 | 1.50000 | ||
| 22 | 2010.01.08 15:00 | buy | 12 | 0.20 | 1.44037 | 1.42870 | 1.50000 | ||
| 23 | 2010.01.08 17:00 | close | 11 | 0.20 | 1.43248 | 1.42990 | 1.50000 | -157.80 | 10137.40 |
| 24 | 2010.01.11 02:00 | close | 12 | 0.20 | 1.44831 | 1.42870 | 1.50000 | 158.84 | 10296.24 |