Strategy Tester Report
SilverTrendTrader_v4_JTPO
AlpariUK-Demo (Build 225)
| Symbol | EURUSD (Euro vs US Dollar) | ||||
| Period | 1 Hour (H1) 2009.12.01 00:00 - 2010.01.15 22:00 (2009.12.01 - 2010.01.17) | ||||
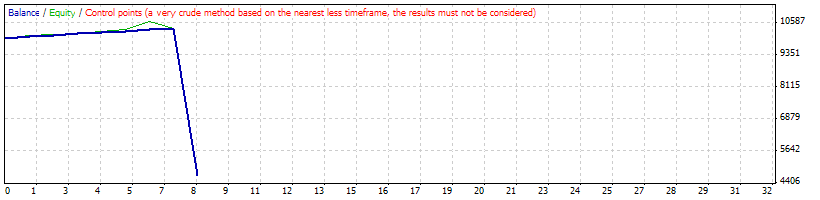
| Model | Control points (a very crude method, the results must not be considered) | ||||
| Parameters | MAPeriod=60; TrailingStop=8; TakeProfit=55; InitialStopLoss=0; FridayNightHour=22; | ||||
| Bars in test | 1753 | Ticks modelled | 19953 | Modelling quality | n/a |
| Mismatched charts errors | 3 | ||||
| Initial deposit | 10000.00 | ||||
| Total net profit | -5296.50 | Gross profit | 380.50 | Gross loss | -5677.00 |
| Profit factor | 0.07 | Expected payoff | -662.06 | ||
| Absolute drawdown | 6959.50 | Maximal drawdown | 7352.00 (70.74%) | Relative drawdown | 70.74% (7352.00) |
| Total trades | 8 | Short positions (won %) | 5 (100.00%) | Long positions (won %) | 3 (66.67%) |
| Profit trades (% of total) | 7 (87.50%) | Loss trades (% of total) | 1 (12.50%) | ||
| Largest | profit trade | 55.00 | loss trade | -5677.00 | |
| Average | profit trade | 54.36 | loss trade | -5677.00 | |
| Maximum | consecutive wins (profit in money) | 7 (380.50) | consecutive losses (loss in money) | 1 (-5677.00) | |
| Maximal | consecutive profit (count of wins) | 380.50 (7) | consecutive loss (count of losses) | -5677.00 (1) | |
| Average | consecutive wins | 7 | consecutive losses | 1 | |
| # | Time | Type | Order | Size | Price | S / L | T / P | Profit | Balance |
| 1 | 2009.12.01 00:00 | buy | 1 | 1.00 | 1.50082 | 0.00000 | 1.50137 | ||
| 2 | 2009.12.01 00:33 | t/p | 1 | 1.00 | 1.50137 | 0.00000 | 1.50137 | 55.00 | 10055.00 |
| 3 | 2009.12.01 03:00 | sell | 2 | 1.00 | 1.50157 | 0.00000 | 1.50102 | ||
| 4 | 2009.12.01 03:15 | t/p | 2 | 1.00 | 1.50102 | 0.00000 | 1.50102 | 55.00 | 10110.00 |
| 5 | 2009.12.01 04:00 | sell | 3 | 1.00 | 1.50156 | 0.00000 | 1.50101 | ||
| 6 | 2009.12.01 04:15 | t/p | 3 | 1.00 | 1.50101 | 0.00000 | 1.50101 | 55.00 | 10165.00 |
| 7 | 2009.12.01 05:00 | sell | 4 | 1.00 | 1.50138 | 0.00000 | 1.50083 | ||
| 8 | 2009.12.01 05:02 | t/p | 4 | 1.00 | 1.50083 | 0.00000 | 1.50083 | 55.00 | 10220.00 |
| 9 | 2009.12.01 07:00 | sell | 5 | 1.00 | 1.50001 | 0.00000 | 1.49946 | ||
| 10 | 2009.12.01 07:20 | t/p | 5 | 1.00 | 1.49946 | 0.00000 | 1.49946 | 55.00 | 10275.00 |
| 11 | 2009.12.01 08:00 | sell | 6 | 1.00 | 1.50198 | 0.00000 | 1.50143 | ||
| 12 | 2009.12.04 14:45 | t/p | 6 | 1.00 | 1.50143 | 0.00000 | 1.50143 | 50.50 | 10325.50 |
| 13 | 2009.12.04 15:00 | buy | 7 | 1.00 | 1.49434 | 0.00000 | 1.49489 | ||
| 14 | 2009.12.04 15:15 | t/p | 7 | 1.00 | 1.49489 | 0.00000 | 1.49489 | 55.00 | 10380.50 |
| 15 | 2009.12.04 16:00 | buy | 8 | 1.00 | 1.49499 | 0.00000 | 1.49554 | ||
| 16 | 2010.01.15 22:57 | close at stop | 8 | 1.00 | 1.43843 | 0.00000 | 1.49554 | -5677.00 | 4703.50 |