Strategy Tester Report
AlpariUK-Demo (Build 225)
| Symbol | EURUSD (Euro vs US Dollar) | ||||
| Period | 1 Hour (H1) 2009.12.01 00:00 - 2010.01.15 22:00 (2009.12.01 - 2010.01.17) | ||||
| Model | Control points (a very crude method, the results must not be considered) | ||||
| Parameters | lots=1; pcci=9; fastmacd=41; slowmacd=58; signalmacd=55; magic=888; slippage=0; | ||||
| Bars in test | 1753 | Ticks modelled | 19953 | Modelling quality | n/a |
| Mismatched charts errors | 1 | ||||
| Initial deposit | 10000.00 | ||||
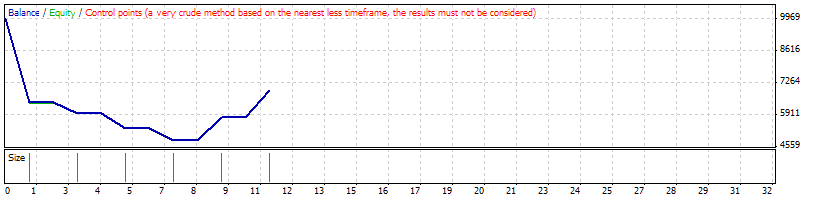
| Total net profit | -3043.50 | Gross profit | 2116.50 | Gross loss | -5160.00 |
| Profit factor | 0.41 | Expected payoff | -276.68 | ||
| Absolute drawdown | 6555.50 | Maximal drawdown | 7008.00 (67.05%) | Relative drawdown | 67.05% (7008.00) |
| Total trades | 11 | Short positions (won %) | 6 (66.67%) | Long positions (won %) | 5 (60.00%) |
| Profit trades (% of total) | 7 (63.64%) | Loss trades (% of total) | 4 (36.36%) | ||
| Largest | profit trade | 1142.00 | loss trade | -3580.50 | |
| Average | profit trade | 302.36 | loss trade | -1290.00 | |
| Maximum | consecutive wins (profit in money) | 4 (2116.50) | consecutive losses (loss in money) | 1 (-3580.50) | |
| Maximal | consecutive profit (count of wins) | 2116.50 (4) | consecutive loss (count of losses) | -3580.50 (1) | |
| Average | consecutive wins | 2 | consecutive losses | 1 | |
| # | Time | Type | Order | Size | Price | S / L | T / P | Profit | Balance |
| 1 | 2009.12.10 05:00 | buy | 1 | 1.00 | 1.47302 | 0.00000 | 0.00000 | ||
| 2 | 2009.12.29 06:00 | sell | 2 | 2.00 | 1.43730 | 0.00000 | 0.00000 | ||
| 3 | 2009.12.29 06:00 | close by | 2 | 1.00 | 1.47302 | 0.00000 | 0.00000 | -3580.50 | 6419.50 |
| 4 | 2009.12.29 06:00 | sell | 3 | 1.00 | 1.43730 | 0.00000 | 0.00000 | ||
| 5 | 2009.12.29 06:00 | close by | 1 | 0.00 | 1.47302 | 0.00000 | 0.00000 | 0.00 | 6419.50 |
| 6 | 2010.01.05 04:00 | buy | 4 | 2.00 | 1.44153 | 0.00000 | 0.00000 | ||
| 7 | 2010.01.05 04:00 | close by | 4 | 1.00 | 1.43730 | 0.00000 | 0.00000 | -430.00 | 5989.50 |
| 8 | 2010.01.05 04:00 | buy | 5 | 1.00 | 1.44153 | 0.00000 | 0.00000 | ||
| 9 | 2010.01.05 04:00 | close by | 3 | 0.00 | 1.43730 | 0.00000 | 0.00000 | 0.00 | 5989.50 |
| 10 | 2010.01.06 10:00 | sell | 6 | 2.00 | 1.43516 | 0.00000 | 0.00000 | ||
| 11 | 2010.01.06 10:00 | close by | 6 | 1.00 | 1.44153 | 0.00000 | 0.00000 | -637.50 | 5352.00 |
| 12 | 2010.01.06 10:00 | sell | 7 | 1.00 | 1.43516 | 0.00000 | 0.00000 | ||
| 13 | 2010.01.06 10:00 | close by | 5 | 0.00 | 1.44153 | 0.00000 | 0.00000 | 0.00 | 5352.00 |
| 14 | 2010.01.07 01:00 | buy | 8 | 2.00 | 1.44025 | 0.00000 | 0.00000 | ||
| 15 | 2010.01.07 01:00 | close by | 8 | 1.00 | 1.43516 | 0.00000 | 0.00000 | -512.00 | 4840.00 |
| 16 | 2010.01.07 01:00 | buy | 9 | 1.00 | 1.44025 | 0.00000 | 0.00000 | ||
| 17 | 2010.01.07 01:00 | close by | 7 | 0.00 | 1.43516 | 0.00000 | 0.00000 | 0.00 | 4840.00 |
| 18 | 2010.01.12 08:00 | sell | 10 | 2.00 | 1.45001 | 0.00000 | 0.00000 | ||
| 19 | 2010.01.12 08:00 | close by | 10 | 1.00 | 1.44025 | 0.00000 | 0.00000 | 974.50 | 5814.50 |
| 20 | 2010.01.12 08:00 | sell | 11 | 1.00 | 1.45001 | 0.00000 | 0.00000 | ||
| 21 | 2010.01.12 08:00 | close by | 9 | 0.00 | 1.44025 | 0.00000 | 0.00000 | 0.00 | 5814.50 |
| 22 | 2010.01.15 22:57 | close at stop | 11 | 1.00 | 1.43854 | 0.00000 | 0.00000 | 1142.00 | 6956.50 |