Strategy Tester Report
AlpariUK-Demo (Build 225)
| Symbol | EURUSD (Euro vs US Dollar) | ||||
| Period | 1 Hour (H1) 2009.12.01 00:00 - 2010.01.15 22:00 (2009.12.01 - 2010.01.17) | ||||
| Model | Control points (a very crude method, the results must not be considered) | ||||
| Parameters | TakeProfit=20; Lots=1; TrailingStop=5; | ||||
| Bars in test | 1753 | Ticks modelled | 19953 | Modelling quality | n/a |
| Mismatched charts errors | 1 | ||||
| Initial deposit | 10000.00 | ||||
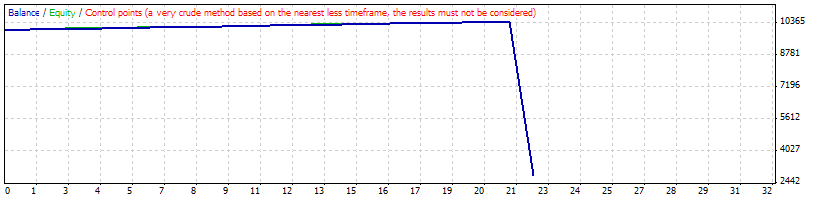
| Total net profit | -7176.50 | Gross profit | 418.00 | Gross loss | -7594.50 |
| Profit factor | 0.06 | Expected payoff | -326.20 | ||
| Absolute drawdown | 8839.50 | Maximal drawdown | 9257.50 (88.86%) | Relative drawdown | 88.86% (9257.50) |
| Total trades | 22 | Short positions (won %) | 0 (0.00%) | Long positions (won %) | 22 (95.45%) |
| Profit trades (% of total) | 21 (95.45%) | Loss trades (% of total) | 1 (4.55%) | ||
| Largest | profit trade | 20.00 | loss trade | -7594.50 | |
| Average | profit trade | 19.90 | loss trade | -7594.50 | |
| Maximum | consecutive wins (profit in money) | 21 (418.00) | consecutive losses (loss in money) | 1 (-7594.50) | |
| Maximal | consecutive profit (count of wins) | 418.00 (21) | consecutive loss (count of losses) | -7594.50 (1) | |
| Average | consecutive wins | 21 | consecutive losses | 1 | |
| # | Time | Type | Order | Size | Price | S / L | T / P | Profit | Balance |
| 1 | 2009.12.01 00:00 | buy | 1 | 1.00 | 1.50082 | 0.00000 | 1.50102 | ||
| 2 | 2009.12.01 00:02 | t/p | 1 | 1.00 | 1.50102 | 0.00000 | 1.50102 | 20.00 | 10020.00 |
| 3 | 2009.12.01 00:02 | buy | 2 | 1.00 | 1.50117 | 0.00000 | 1.50137 | ||
| 4 | 2009.12.01 00:33 | t/p | 2 | 1.00 | 1.50137 | 0.00000 | 1.50137 | 20.00 | 10040.00 |
| 5 | 2009.12.01 00:33 | buy | 3 | 1.00 | 1.50209 | 0.00000 | 1.50229 | ||
| 6 | 2009.12.01 00:40 | t/p | 3 | 1.00 | 1.50229 | 0.00000 | 1.50229 | 20.00 | 10060.00 |
| 7 | 2009.12.01 00:40 | buy | 4 | 1.00 | 1.50306 | 0.00000 | 1.50326 | ||
| 8 | 2009.12.01 00:46 | t/p | 4 | 1.00 | 1.50326 | 0.00000 | 1.50326 | 20.00 | 10080.00 |
| 9 | 2009.12.01 00:46 | buy | 5 | 1.00 | 1.50403 | 0.00000 | 1.50423 | ||
| 10 | 2009.12.01 09:10 | t/p | 5 | 1.00 | 1.50423 | 0.00000 | 1.50423 | 20.00 | 10100.00 |
| 11 | 2009.12.01 09:10 | buy | 6 | 1.00 | 1.50493 | 0.00000 | 1.50513 | ||
| 12 | 2009.12.01 09:16 | t/p | 6 | 1.00 | 1.50513 | 0.00000 | 1.50513 | 20.00 | 10120.00 |
| 13 | 2009.12.01 09:16 | buy | 7 | 1.00 | 1.50575 | 0.00000 | 1.50595 | ||
| 14 | 2009.12.01 09:45 | t/p | 7 | 1.00 | 1.50595 | 0.00000 | 1.50595 | 20.00 | 10140.00 |
| 15 | 2009.12.01 09:45 | buy | 8 | 1.00 | 1.50615 | 0.00000 | 1.50635 | ||
| 16 | 2009.12.01 09:50 | t/p | 8 | 1.00 | 1.50635 | 0.00000 | 1.50635 | 20.00 | 10160.00 |
| 17 | 2009.12.01 09:50 | buy | 9 | 1.00 | 1.50686 | 0.00000 | 1.50706 | ||
| 18 | 2009.12.01 10:15 | t/p | 9 | 1.00 | 1.50706 | 0.00000 | 1.50706 | 20.00 | 10180.00 |
| 19 | 2009.12.01 10:15 | buy | 10 | 1.00 | 1.50717 | 0.00000 | 1.50737 | ||
| 20 | 2009.12.01 10:20 | t/p | 10 | 1.00 | 1.50737 | 0.00000 | 1.50737 | 20.00 | 10200.00 |
| 21 | 2009.12.01 10:20 | buy | 11 | 1.00 | 1.50755 | 0.00000 | 1.50775 | ||
| 22 | 2009.12.01 11:20 | t/p | 11 | 1.00 | 1.50775 | 0.00000 | 1.50775 | 20.00 | 10220.00 |
| 23 | 2009.12.01 11:20 | buy | 12 | 1.00 | 1.50806 | 0.00000 | 1.50826 | ||
| 24 | 2009.12.01 14:15 | t/p | 12 | 1.00 | 1.50826 | 0.00000 | 1.50826 | 20.00 | 10240.00 |
| 25 | 2009.12.01 14:15 | buy | 13 | 1.00 | 1.50851 | 0.00000 | 1.50871 | ||
| 26 | 2009.12.01 14:20 | t/p | 13 | 1.00 | 1.50871 | 0.00000 | 1.50871 | 20.00 | 10260.00 |
| 27 | 2009.12.01 14:20 | buy | 14 | 1.00 | 1.50946 | 0.00000 | 1.50966 | ||
| 28 | 2009.12.01 15:20 | t/p | 14 | 1.00 | 1.50966 | 0.00000 | 1.50966 | 20.00 | 10280.00 |
| 29 | 2009.12.01 15:20 | buy | 15 | 1.00 | 1.51027 | 0.00000 | 1.51047 | ||
| 30 | 2009.12.01 17:10 | t/p | 15 | 1.00 | 1.51047 | 0.00000 | 1.51047 | 20.00 | 10300.00 |
| 31 | 2009.12.01 17:10 | buy | 16 | 1.00 | 1.51106 | 0.00000 | 1.51126 | ||
| 32 | 2009.12.01 17:16 | t/p | 16 | 1.00 | 1.51126 | 0.00000 | 1.51126 | 20.00 | 10320.00 |
| 33 | 2009.12.01 17:16 | buy | 17 | 1.00 | 1.51172 | 0.00000 | 1.51192 | ||
| 34 | 2009.12.03 08:20 | t/p | 17 | 1.00 | 1.51192 | 0.00000 | 1.51192 | 18.00 | 10338.00 |
| 35 | 2009.12.03 08:20 | buy | 18 | 1.00 | 1.51225 | 0.00000 | 1.51245 | ||
| 36 | 2009.12.03 08:32 | t/p | 18 | 1.00 | 1.51245 | 0.00000 | 1.51245 | 20.00 | 10358.00 |
| 37 | 2009.12.03 08:32 | buy | 19 | 1.00 | 1.51272 | 0.00000 | 1.51292 | ||
| 38 | 2009.12.03 11:20 | t/p | 19 | 1.00 | 1.51292 | 0.00000 | 1.51292 | 20.00 | 10378.00 |
| 39 | 2009.12.03 11:20 | buy | 20 | 1.00 | 1.51315 | 0.00000 | 1.51335 | ||
| 40 | 2009.12.03 14:32 | t/p | 20 | 1.00 | 1.51335 | 0.00000 | 1.51335 | 20.00 | 10398.00 |
| 41 | 2009.12.03 14:32 | buy | 21 | 1.00 | 1.51361 | 0.00000 | 1.51381 | ||
| 42 | 2009.12.03 14:37 | t/p | 21 | 1.00 | 1.51381 | 0.00000 | 1.51381 | 20.00 | 10418.00 |
| 43 | 2009.12.03 14:37 | buy | 22 | 1.00 | 1.51416 | 0.00000 | 1.51436 | ||
| 44 | 2010.01.15 22:57 | close at stop | 22 | 1.00 | 1.43843 | 0.00000 | 1.51436 | -7594.50 | 2823.50 |