Strategy Tester Report
AlpariUK-Demo (Build 225)
| Symbol | EURUSD (Euro vs US Dollar) | ||||
| Period | 1 Hour (H1) 2009.12.01 00:00 - 2010.01.15 22:00 (2009.12.01 - 2010.01.17) | ||||
| Model | Control points (a very crude method, the results must not be considered) | ||||
| Parameters | MaximumRisk=0.01; DecreaseFactor=3; OrderPeriod=300; StopL=1000; Ga=0.9; UpLine=0.95; MiddleLine=0.5; DownLine=0.05; prevbars=0; | ||||
| Bars in test | 1753 | Ticks modelled | 19953 | Modelling quality | n/a |
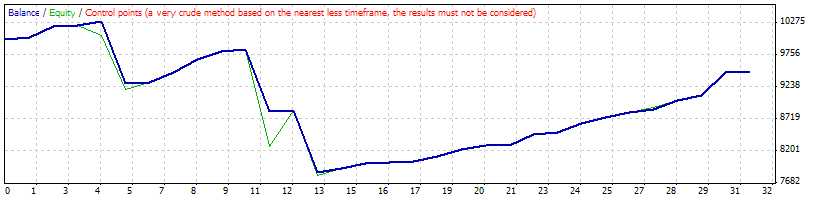
| Mismatched charts errors | 1 | ||||
| Initial deposit | 10000.00 | ||||
| Total net profit | -514.00 | Gross profit | 2486.50 | Gross loss | -3000.50 |
| Profit factor | 0.83 | Expected payoff | -16.58 | ||
| Absolute drawdown | 2388.00 | Maximal drawdown | 2763.00 (26.63%) | Relative drawdown | 26.63% (2763.00) |
| Total trades | 31 | Short positions (won %) | 13 (100.00%) | Long positions (won %) | 18 (83.33%) |
| Profit trades (% of total) | 28 (90.32%) | Loss trades (% of total) | 3 (9.68%) | ||
| Largest | profit trade | 371.00 | loss trade | -1000.50 | |
| Average | profit trade | 88.80 | loss trade | -1000.17 | |
| Maximum | consecutive wins (profit in money) | 18 (1636.00) | consecutive losses (loss in money) | 1 (-1000.50) | |
| Maximal | consecutive profit (count of wins) | 1636.00 (18) | consecutive loss (count of losses) | -1000.50 (1) | |
| Average | consecutive wins | 7 | consecutive losses | 1 | |
| # | Time | Type | Order | Size | Price | S / L | T / P | Profit | Balance |
| 1 | 2009.12.02 04:00 | buy | 1 | 1.00 | 1.50870 | 1.49870 | 0.00000 | ||
| 2 | 2009.12.02 05:00 | close | 1 | 1.00 | 1.50907 | 1.49870 | 0.00000 | 37.00 | 10037.00 |
| 3 | 2009.12.03 00:00 | buy | 2 | 1.00 | 1.50488 | 1.49488 | 0.00000 | ||
| 4 | 2009.12.03 01:00 | close | 2 | 1.00 | 1.50665 | 1.49488 | 0.00000 | 177.00 | 10214.00 |
| 5 | 2009.12.03 07:00 | sell | 3 | 1.00 | 1.50801 | 1.51801 | 0.00000 | ||
| 6 | 2009.12.03 16:00 | close | 3 | 1.00 | 1.50779 | 1.51801 | 0.00000 | 22.00 | 10236.00 |
| 7 | 2009.12.03 20:00 | buy | 4 | 1.00 | 1.50920 | 1.49920 | 0.00000 | ||
| 8 | 2009.12.04 04:00 | buy | 5 | 1.00 | 1.50626 | 1.49626 | 0.00000 | ||
| 9 | 2009.12.04 08:00 | close | 5 | 1.00 | 1.50691 | 1.49626 | 0.00000 | 65.00 | 10301.00 |
| 10 | 2009.12.04 14:45 | s/l | 4 | 1.00 | 1.49920 | 1.49920 | 0.00000 | -1000.50 | 9300.50 |
| 11 | 2009.12.07 00:00 | buy | 6 | 1.00 | 1.48700 | 1.47700 | 0.00000 | ||
| 12 | 2009.12.07 01:00 | close | 6 | 1.00 | 1.48704 | 1.47700 | 0.00000 | 4.00 | 9304.50 |
| 13 | 2009.12.07 16:00 | buy | 7 | 1.00 | 1.48102 | 1.47102 | 0.00000 | ||
| 14 | 2009.12.07 17:00 | close | 7 | 1.00 | 1.48277 | 1.47102 | 0.00000 | 175.00 | 9479.50 |
| 15 | 2009.12.10 10:00 | buy | 8 | 1.00 | 1.47196 | 1.46196 | 0.00000 | ||
| 16 | 2009.12.10 12:00 | close | 8 | 1.00 | 1.47408 | 1.46196 | 0.00000 | 212.00 | 9691.50 |
| 17 | 2009.12.14 02:00 | buy | 9 | 1.00 | 1.46245 | 1.45245 | 0.00000 | ||
| 18 | 2009.12.14 03:00 | close | 9 | 1.00 | 1.46367 | 1.45245 | 0.00000 | 122.00 | 9813.50 |
| 19 | 2009.12.15 02:00 | sell | 10 | 1.00 | 1.46512 | 1.47512 | 0.00000 | ||
| 20 | 2009.12.15 04:00 | close | 10 | 1.00 | 1.46487 | 1.47512 | 0.00000 | 25.00 | 9838.50 |
| 21 | 2009.12.15 09:00 | buy | 11 | 1.00 | 1.46106 | 1.45106 | 0.00000 | ||
| 22 | 2009.12.15 10:00 | buy | 12 | 1.00 | 1.45675 | 1.44675 | 0.00000 | ||
| 23 | 2009.12.15 17:50 | s/l | 11 | 1.00 | 1.45106 | 1.45106 | 0.00000 | -1000.00 | 8838.50 |
| 24 | 2009.12.16 13:00 | close | 12 | 1.00 | 1.45687 | 1.44675 | 0.00000 | 11.50 | 8850.00 |
| 25 | 2009.12.17 04:00 | buy | 13 | 1.00 | 1.44320 | 1.43320 | 0.00000 | ||
| 26 | 2009.12.17 11:50 | s/l | 13 | 1.00 | 1.43320 | 1.43320 | 0.00000 | -1000.00 | 7850.00 |
| 27 | 2009.12.17 20:00 | buy | 14 | 1.00 | 1.43428 | 1.42428 | 0.00000 | ||
| 28 | 2009.12.17 21:00 | close | 14 | 1.00 | 1.43503 | 1.42428 | 0.00000 | 75.00 | 7925.00 |
| 29 | 2009.12.18 08:00 | sell | 15 | 1.00 | 1.43744 | 1.44744 | 0.00000 | ||
| 30 | 2009.12.18 13:00 | close | 15 | 1.00 | 1.43668 | 1.44744 | 0.00000 | 76.00 | 8001.00 |
| 31 | 2009.12.21 05:00 | sell | 16 | 1.00 | 1.43525 | 1.44525 | 0.00000 | ||
| 32 | 2009.12.21 06:00 | close | 16 | 1.00 | 1.43505 | 1.44525 | 0.00000 | 20.00 | 8021.00 |
| 33 | 2009.12.21 07:00 | sell | 17 | 1.00 | 1.43361 | 1.44361 | 0.00000 | ||
| 34 | 2009.12.21 08:00 | close | 17 | 1.00 | 1.43349 | 1.44361 | 0.00000 | 12.00 | 8033.00 |
| 35 | 2009.12.23 17:00 | sell | 18 | 1.00 | 1.43328 | 1.44328 | 0.00000 | ||
| 36 | 2009.12.23 22:00 | close | 18 | 1.00 | 1.43250 | 1.44328 | 0.00000 | 78.00 | 8111.00 |
| 37 | 2009.12.24 04:00 | sell | 19 | 1.00 | 1.43522 | 1.44522 | 0.00000 | ||
| 38 | 2009.12.24 05:00 | close | 19 | 1.00 | 1.43407 | 1.44522 | 0.00000 | 115.00 | 8226.00 |
| 39 | 2009.12.24 09:00 | sell | 20 | 1.00 | 1.43648 | 1.44648 | 0.00000 | ||
| 40 | 2009.12.24 10:00 | close | 20 | 1.00 | 1.43584 | 1.44648 | 0.00000 | 64.00 | 8290.00 |
| 41 | 2009.12.24 12:00 | sell | 21 | 1.00 | 1.44049 | 1.45049 | 0.00000 | ||
| 42 | 2009.12.24 13:00 | close | 21 | 1.00 | 1.44046 | 1.45049 | 0.00000 | 3.00 | 8293.00 |
| 43 | 2009.12.24 15:00 | sell | 22 | 1.00 | 1.43839 | 1.44839 | 0.00000 | ||
| 44 | 2009.12.24 16:00 | close | 22 | 1.00 | 1.43660 | 1.44839 | 0.00000 | 179.00 | 8472.00 |
| 45 | 2009.12.28 13:00 | sell | 23 | 1.00 | 1.44048 | 1.45048 | 0.00000 | ||
| 46 | 2009.12.28 15:00 | close | 23 | 1.00 | 1.44017 | 1.45048 | 0.00000 | 31.00 | 8503.00 |
| 47 | 2009.12.30 07:00 | buy | 24 | 1.00 | 1.43251 | 1.42251 | 0.00000 | ||
| 48 | 2009.12.30 08:00 | close | 24 | 1.00 | 1.43397 | 1.42251 | 0.00000 | 146.00 | 8649.00 |
| 49 | 2010.01.06 03:00 | buy | 25 | 1.00 | 1.43681 | 1.42681 | 0.00000 | ||
| 50 | 2010.01.06 11:00 | close | 25 | 1.00 | 1.43771 | 1.42681 | 0.00000 | 90.00 | 8739.00 |
| 51 | 2010.01.07 00:00 | sell | 26 | 1.00 | 1.43999 | 1.44999 | 0.00000 | ||
| 52 | 2010.01.07 07:00 | close | 26 | 1.00 | 1.43911 | 1.44999 | 0.00000 | 88.00 | 8827.00 |
| 53 | 2010.01.08 05:00 | buy | 27 | 1.00 | 1.43139 | 1.42139 | 0.00000 | ||
| 54 | 2010.01.08 06:00 | buy | 28 | 1.00 | 1.43132 | 1.42132 | 0.00000 | ||
| 55 | 2010.01.08 09:00 | close | 27 | 1.00 | 1.43178 | 1.42139 | 0.00000 | 39.00 | 8866.00 |
| 56 | 2010.01.08 10:00 | close | 28 | 1.00 | 1.43288 | 1.42132 | 0.00000 | 156.00 | 9022.00 |
| 57 | 2010.01.13 05:00 | buy | 29 | 1.00 | 1.44802 | 1.43802 | 0.00000 | ||
| 58 | 2010.01.13 06:00 | close | 29 | 1.00 | 1.44878 | 1.43802 | 0.00000 | 76.00 | 9098.00 |
| 59 | 2010.01.13 13:00 | sell | 30 | 1.00 | 1.45458 | 1.46458 | 0.00000 | ||
| 60 | 2010.01.13 17:00 | close | 30 | 1.00 | 1.45087 | 1.46458 | 0.00000 | 371.00 | 9469.00 |
| 61 | 2010.01.14 15:00 | buy | 31 | 1.00 | 1.45089 | 1.44089 | 0.00000 | ||
| 62 | 2010.01.14 20:00 | close | 31 | 1.00 | 1.45106 | 1.44089 | 0.00000 | 17.00 | 9486.00 |