Strategy Tester Report
AlpariUK-Demo (Build 225)
| Symbol | USDCAD (US Dollar vs Canadian Dollar) | ||||
| Period | 1 Hour (H1) 2009.12.01 00:00 - 2009.12.31 18:00 (2009.12.01 - 2010.01.01) | ||||
| Model | Control points (a very crude method, the results must not be considered) | ||||
| Parameters | min_gapsize=1; lotsize_gap=0.1; | ||||
| Bars in test | 1515 | Ticks modelled | 13777 | Modelling quality | n/a |
| Mismatched charts errors | 2 | ||||
| Initial deposit | 10000.00 | ||||
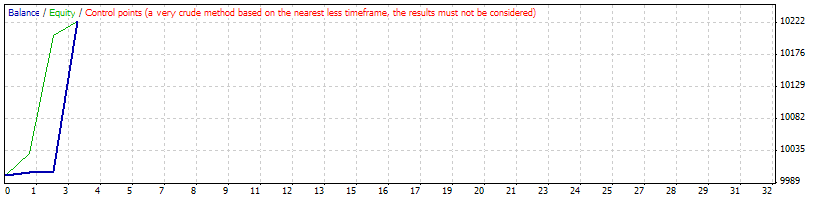
| Total net profit | 224.71 | Gross profit | 224.71 | Gross loss | 0.00 |
| Profit factor | Expected payoff | 74.90 | |||
| Absolute drawdown | 19.68 | Maximal drawdown | 206.02 (2.00%) | Relative drawdown | 2.00% (206.02) |
| Total trades | 3 | Short positions (won %) | 2 (100.00%) | Long positions (won %) | 1 (100.00%) |
| Profit trades (% of total) | 3 (100.00%) | Loss trades (% of total) | 0 (0.00%) | ||
| Largest | profit trade | 219.82 | loss trade | 0.00 | |
| Average | profit trade | 74.90 | loss trade | 0.00 | |
| Maximum | consecutive wins (profit in money) | 3 (224.71) | consecutive losses (loss in money) | 0 (0.00) | |
| Maximal | consecutive profit (count of wins) | 224.71 (3) | consecutive loss (count of losses) | 0.00 (0) | |
| Average | consecutive wins | 3 | consecutive losses | 0 | |
| # | Time | Type | Order | Size | Price | S / L | T / P | Profit | Balance |
| 1 | 2009.12.18 01:00 | sell | 1 | 0.10 | 1.07012 | 0.00000 | 0.00064 | ||
| 2 | 2009.12.21 00:00 | sell | 2 | 0.10 | 1.06759 | 0.00000 | 1.06718 | ||
| 3 | 2009.12.21 01:15 | t/p | 2 | 0.10 | 1.06718 | 0.00000 | 1.06718 | 3.84 | 10003.84 |
| 4 | 2009.12.28 00:00 | buy | 3 | 0.10 | 1.04848 | 0.00000 | 1.04859 | ||
| 5 | 2009.12.28 00:32 | t/p | 3 | 0.10 | 1.04859 | 0.00000 | 1.04859 | 1.05 | 10004.89 |
| 6 | 2009.12.31 18:57 | close at stop | 1 | 0.10 | 1.04709 | 0.00000 | 0.00064 | 219.82 | 10224.71 |