Strategy Tester Report
AlpariUK-Demo (Build 225)
| Symbol | USDCAD (US Dollar vs Canadian Dollar) | ||||
| Period | 1 Hour (H1) 2009.12.01 00:00 - 2009.12.31 18:00 (2009.12.01 - 2010.01.01) | ||||
| Model | Control points (a very crude method, the results must not be considered) | ||||
| Parameters | Period_MA_Long=100; Period_BB=25; reserve=50; deviation=1.5; Lots=0.1; | ||||
| Bars in test | 1515 | Ticks modelled | 13777 | Modelling quality | n/a |
| Mismatched charts errors | 2 | ||||
| Initial deposit | 10000.00 | ||||
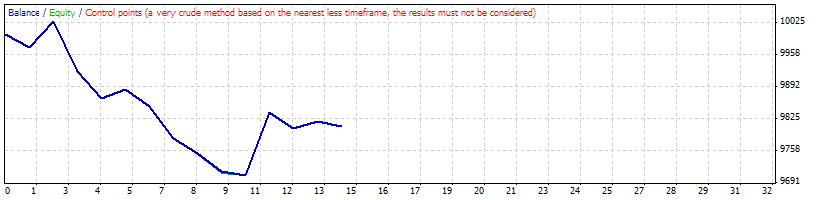
| Total net profit | -190.11 | Gross profit | 217.57 | Gross loss | -407.68 |
| Profit factor | 0.53 | Expected payoff | -13.58 | ||
| Absolute drawdown | 321.17 | Maximal drawdown | 400.90 (3.98%) | Relative drawdown | 3.98% (400.90) |
| Total trades | 14 | Short positions (won %) | 14 (28.57%) | Long positions (won %) | 0 (0.00%) |
| Profit trades (% of total) | 4 (28.57%) | Loss trades (% of total) | 10 (71.43%) | ||
| Largest | profit trade | 131.41 | loss trade | -104.01 | |
| Average | profit trade | 54.39 | loss trade | -40.77 | |
| Maximum | consecutive wins (profit in money) | 1 (131.41) | consecutive losses (loss in money) | 5 (-177.92) | |
| Maximal | consecutive profit (count of wins) | 131.41 (1) | consecutive loss (count of losses) | -177.92 (5) | |
| Average | consecutive wins | 1 | consecutive losses | 2 | |
| # | Time | Type | Order | Size | Price | S / L | T / P | Profit | Balance |
| 1 | 2009.12.01 01:00 | sell | 1 | 0.10 | 1.05391 | 1.05884 | 0.00000 | ||
| 2 | 2009.12.01 03:00 | close | 1 | 0.10 | 1.05671 | 1.05884 | 0.00000 | -26.50 | 9973.50 |
| 3 | 2009.12.01 09:00 | sell | 2 | 0.10 | 1.05224 | 1.05808 | 0.00000 | ||
| 4 | 2009.12.02 09:00 | close | 2 | 0.10 | 1.04651 | 1.05808 | 0.00000 | 54.74 | 10028.24 |
| 5 | 2009.12.04 14:00 | sell | 3 | 0.10 | 1.04658 | 1.05860 | 0.00000 | ||
| 6 | 2009.12.04 20:00 | close | 3 | 0.10 | 1.05758 | 1.05860 | 0.00000 | -104.01 | 9924.23 |
| 7 | 2009.12.07 19:00 | sell | 4 | 0.10 | 1.04978 | 1.06175 | 0.00000 | ||
| 8 | 2009.12.08 09:00 | close | 4 | 0.10 | 1.05576 | 1.06175 | 0.00000 | -56.65 | 9867.58 |
| 9 | 2009.12.09 17:00 | sell | 5 | 0.10 | 1.05478 | 1.06597 | 0.00000 | ||
| 10 | 2009.12.11 08:00 | close | 5 | 0.10 | 1.05290 | 1.06597 | 0.00000 | 17.82 | 9885.40 |
| 11 | 2009.12.11 14:00 | sell | 6 | 0.10 | 1.04922 | 1.05292 | 0.00000 | ||
| 12 | 2009.12.11 15:15 | s/l | 6 | 0.10 | 1.05292 | 1.05292 | 0.00000 | -35.14 | 9850.26 |
| 13 | 2009.12.15 06:00 | sell | 7 | 0.10 | 1.05559 | 1.06425 | 0.00000 | ||
| 14 | 2009.12.15 10:00 | close | 7 | 0.10 | 1.06256 | 1.06425 | 0.00000 | -65.60 | 9784.66 |
| 15 | 2009.12.16 10:00 | sell | 8 | 0.10 | 1.05972 | 1.06320 | 0.00000 | ||
| 16 | 2009.12.16 11:50 | s/l | 8 | 0.10 | 1.06320 | 1.06320 | 0.00000 | -32.72 | 9751.94 |
| 17 | 2009.12.16 14:00 | sell | 9 | 0.10 | 1.05899 | 1.06295 | 0.00000 | ||
| 18 | 2009.12.16 20:20 | s/l | 9 | 0.10 | 1.06295 | 1.06295 | 0.00000 | -37.24 | 9714.70 |
| 19 | 2009.12.18 04:00 | sell | 10 | 0.10 | 1.06684 | 1.07291 | 0.00000 | ||
| 20 | 2009.12.21 01:00 | close | 10 | 0.10 | 1.06761 | 1.07291 | 0.00000 | -7.22 | 9707.48 |
| 21 | 2009.12.21 12:00 | sell | 11 | 0.10 | 1.06281 | 1.06873 | 0.00000 | ||
| 22 | 2009.12.24 15:00 | close | 11 | 0.10 | 1.04902 | 1.06873 | 0.00000 | 131.41 | 9838.90 |
| 23 | 2009.12.28 04:00 | sell | 12 | 0.10 | 1.04630 | 1.04999 | 0.00000 | ||
| 24 | 2009.12.28 09:00 | close | 12 | 0.10 | 1.04982 | 1.04999 | 0.00000 | -33.53 | 9805.37 |
| 25 | 2009.12.28 15:00 | sell | 13 | 0.10 | 1.04523 | 1.04973 | 0.00000 | ||
| 26 | 2009.12.29 21:00 | close | 13 | 0.10 | 1.04381 | 1.04973 | 0.00000 | 13.59 | 9818.96 |
| 27 | 2009.12.31 18:00 | sell | 14 | 0.10 | 1.04614 | 1.05609 | 0.00000 | ||
| 28 | 2009.12.31 18:57 | close at stop | 14 | 0.10 | 1.04709 | 1.05609 | 0.00000 | -9.07 | 9809.89 |