Strategy Tester Report
AlpariUK-Demo (Build 225)
| Symbol | USDCAD (US Dollar vs Canadian Dollar) | ||||
| Period | 1 Hour (H1) 2009.12.01 00:00 - 2009.12.31 18:00 (2009.12.01 - 2010.01.01) | ||||
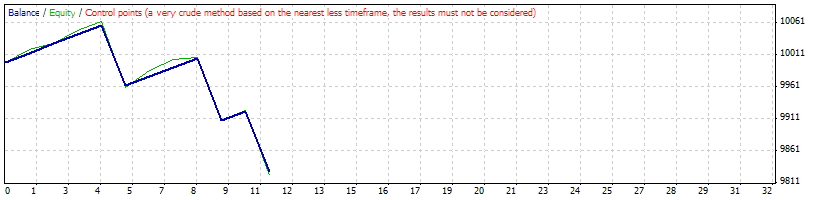
| Model | Control points (a very crude method, the results must not be considered) | ||||
| Parameters | Lots=0.1; StopLoss=1000; TakeProfit=150; TrailingStop=0; ZN=1; ZM=0; per=21; d=3; depth=12; deviation=5; backstep=3; mgod=2005; porog=300; test=1; imps=30; impb=-30; k1=30; k2=60; | ||||
| Bars in test | 1515 | Ticks modelled | 13777 | Modelling quality | n/a |
| Mismatched charts errors | 2 | ||||
| Initial deposit | 10000.00 | ||||
| Total net profit | -171.45 | Gross profit | 113.74 | Gross loss | -285.19 |
| Profit factor | 0.40 | Expected payoff | -15.59 | ||
| Absolute drawdown | 171.45 | Maximal drawdown | 235.97 (2.34%) | Relative drawdown | 2.34% (235.97) |
| Total trades | 11 | Short positions (won %) | 5 (60.00%) | Long positions (won %) | 6 (83.33%) |
| Profit trades (% of total) | 8 (72.73%) | Loss trades (% of total) | 3 (27.27%) | ||
| Largest | profit trade | 14.39 | loss trade | -96.33 | |
| Average | profit trade | 14.22 | loss trade | -95.06 | |
| Maximum | consecutive wins (profit in money) | 4 (57.03) | consecutive losses (loss in money) | 1 (-96.33) | |
| Maximal | consecutive profit (count of wins) | 57.03 (4) | consecutive loss (count of losses) | -96.33 (1) | |
| Average | consecutive wins | 3 | consecutive losses | 1 | |
| # | Time | Type | Order | Size | Price | S / L | T / P | Profit | Balance |
| 1 | 2009.12.04 14:59 | buy | 1 | 0.10 | 1.04892 | 1.03892 | 1.05042 | ||
| 2 | 2009.12.04 15:02 | t/p | 1 | 0.10 | 1.05042 | 1.03892 | 1.05042 | 14.28 | 10014.28 |
| 3 | 2009.12.04 15:59 | buy | 2 | 0.10 | 1.04696 | 1.03696 | 1.04846 | ||
| 4 | 2009.12.04 16:10 | t/p | 2 | 0.10 | 1.04846 | 1.03696 | 1.04846 | 14.31 | 10028.59 |
| 5 | 2009.12.04 20:59 | sell | 3 | 0.10 | 1.05921 | 1.06921 | 1.05771 | ||
| 6 | 2009.12.04 21:20 | t/p | 3 | 0.10 | 1.05771 | 1.06921 | 1.05771 | 14.19 | 10042.78 |
| 7 | 2009.12.11 11:59 | buy | 4 | 0.10 | 1.05009 | 1.04009 | 1.05159 | ||
| 8 | 2009.12.11 15:15 | t/p | 4 | 0.10 | 1.05159 | 1.04009 | 1.05159 | 14.25 | 10057.03 |
| 9 | 2009.12.11 16:59 | sell | 5 | 0.10 | 1.05489 | 1.06489 | 1.05339 | ||
| 10 | 2009.12.14 12:10 | s/l | 5 | 0.10 | 1.06489 | 1.06489 | 1.05339 | -93.93 | 9963.10 |
| 11 | 2009.12.15 14:59 | sell | 6 | 0.10 | 1.06084 | 1.07084 | 1.05934 | ||
| 12 | 2009.12.15 15:20 | t/p | 6 | 0.10 | 1.05934 | 1.07084 | 1.05934 | 14.17 | 9977.27 |
| 13 | 2009.12.17 04:59 | sell | 7 | 0.10 | 1.06739 | 1.07739 | 1.06589 | ||
| 14 | 2009.12.18 03:16 | t/p | 7 | 0.10 | 1.06589 | 1.07739 | 1.06589 | 14.04 | 9991.32 |
| 15 | 2009.12.21 12:59 | buy | 8 | 0.10 | 1.06102 | 1.05102 | 1.06252 | ||
| 16 | 2009.12.21 19:15 | t/p | 8 | 0.10 | 1.06252 | 1.05102 | 1.06252 | 14.11 | 10005.43 |
| 17 | 2009.12.23 14:59 | buy | 9 | 0.10 | 1.05173 | 1.04173 | 1.05323 | ||
| 18 | 2009.12.28 18:16 | s/l | 9 | 0.10 | 1.04173 | 1.04173 | 1.05323 | -96.33 | 9909.10 |
| 19 | 2009.12.29 10:59 | buy | 10 | 0.10 | 1.04068 | 1.03068 | 1.04218 | ||
| 20 | 2009.12.29 17:10 | t/p | 10 | 0.10 | 1.04218 | 1.03068 | 1.04218 | 14.39 | 9923.49 |
| 21 | 2009.12.29 22:59 | sell | 11 | 0.10 | 1.04318 | 1.05318 | 1.04168 | ||
| 22 | 2009.12.30 15:20 | s/l | 11 | 0.10 | 1.05318 | 1.05318 | 1.04168 | -94.94 | 9828.55 |