Strategy Tester Report
AlpariUK-Demo (Build 225)
| Symbol | USDCAD (US Dollar vs Canadian Dollar) | ||||
| Period | 1 Hour (H1) 2009.12.01 00:00 - 2009.12.31 18:00 (2009.12.01 - 2010.01.01) | ||||
| Model | Control points (a very crude method, the results must not be considered) | ||||
| Parameters | Lots=0.1; SndMl=true; isFloatLots=false; DcF=3; MaxR=0.02; TgtProfit=1; Trailing=30; isTradeDay=false; isTrace=false; | ||||
| Bars in test | 1515 | Ticks modelled | 13777 | Modelling quality | n/a |
| Mismatched charts errors | 2 | ||||
| Initial deposit | 10000.00 | ||||
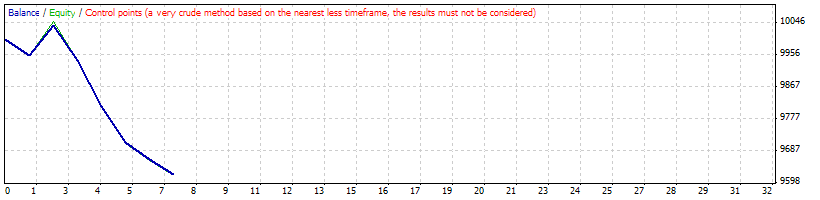
| Total net profit | -379.78 | Gross profit | 84.15 | Gross loss | -463.93 |
| Profit factor | 0.18 | Expected payoff | -54.25 | ||
| Absolute drawdown | 379.78 | Maximal drawdown | 520.03 (5.13%) | Relative drawdown | 5.13% (520.03) |
| Total trades | 7 | Short positions (won %) | 2 (0.00%) | Long positions (won %) | 5 (20.00%) |
| Profit trades (% of total) | 1 (14.29%) | Loss trades (% of total) | 6 (85.71%) | ||
| Largest | profit trade | 84.15 | loss trade | -127.32 | |
| Average | profit trade | 84.15 | loss trade | -77.32 | |
| Maximum | consecutive wins (profit in money) | 1 (84.15) | consecutive losses (loss in money) | 5 (-419.55) | |
| Maximal | consecutive profit (count of wins) | 84.15 (1) | consecutive loss (count of losses) | -419.55 (5) | |
| Average | consecutive wins | 1 | consecutive losses | 3 | |
| # | Time | Type | Order | Size | Price | S / L | T / P | Profit | Balance |
| 1 | 2009.12.03 20:00 | sell | 1 | 0.10 | 1.05214 | 1.05683 | 1.04553 | ||
| 2 | 2009.12.03 22:40 | s/l | 1 | 0.10 | 1.05683 | 1.05683 | 1.04553 | -44.38 | 9955.62 |
| 3 | 2009.12.04 19:00 | buy | 2 | 0.10 | 1.05257 | 1.04172 | 1.06152 | ||
| 4 | 2009.12.07 09:40 | t/p | 2 | 0.10 | 1.06152 | 1.04172 | 1.06152 | 84.15 | 10039.77 |
| 5 | 2009.12.07 11:00 | sell | 3 | 0.10 | 1.05911 | 1.06968 | 1.04749 | ||
| 6 | 2009.12.17 05:45 | s/l | 3 | 0.10 | 1.06968 | 1.06968 | 1.04749 | -99.37 | 9940.40 |
| 7 | 2009.12.18 18:00 | buy | 4 | 0.10 | 1.06852 | 1.05510 | 1.07641 | ||
| 8 | 2009.12.21 13:50 | s/l | 4 | 0.10 | 1.05510 | 1.05510 | 1.07641 | -127.32 | 9813.08 |
| 9 | 2009.12.22 21:00 | buy | 5 | 0.10 | 1.05632 | 1.04583 | 1.07062 | ||
| 10 | 2009.12.24 11:16 | s/l | 5 | 0.10 | 1.04583 | 1.04583 | 1.07062 | -100.60 | 9712.48 |
| 11 | 2009.12.28 06:00 | buy | 6 | 0.10 | 1.04737 | 1.04235 | 1.05183 | ||
| 12 | 2009.12.28 17:26 | s/l | 6 | 0.10 | 1.04235 | 1.04235 | 1.05183 | -48.18 | 9664.30 |
| 13 | 2009.12.29 11:00 | buy | 7 | 0.10 | 1.04128 | 1.03671 | 1.04802 | ||
| 14 | 2009.12.29 14:50 | s/l | 7 | 0.10 | 1.03671 | 1.03671 | 1.04802 | -44.08 | 9620.22 |