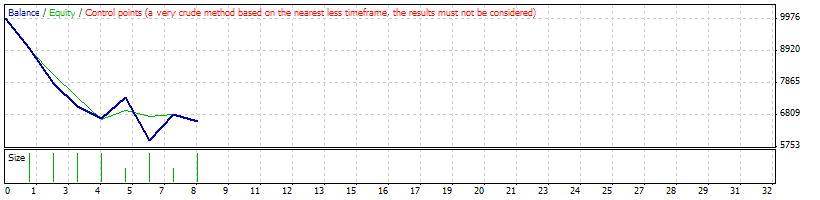
Strategy Tester Report
AlpariUK-Demo (Build 225)
| Symbol | USDCAD (US Dollar vs Canadian Dollar) | ||||
| Period | 1 Hour (H1) 2009.12.01 00:00 - 2009.12.31 18:00 (2009.12.01 - 2010.01.01) | ||||
| Model | Control points (a very crude method, the results must not be considered) | ||||
| Parameters | x="Íŕńňđîéęč MACD:"; FastEMA=12; SlowEMA=24; predel=6; x1="Íŕńňđîéęč MA:"; SMA1=50; SMA2=100; otstup=10; x2="Çíŕ÷ĺíčĺ áŕđîâ äë˙ đŕń÷ĺňŕ Ńňîď-Ëîńń :"; stoplossbars=6; x3="Ęîýôôčöčĺíň äë˙ đŕń÷ĺňŕ ďđîôčň óđîâí˙ č çŕęđűňč˙ ďîëîâčíű ďîçčöčé:"; pprofitum=2; x4="ôčëüňđ ďî ADX:"; enable=0; periodADX=14; Lots=1; | ||||
| Bars in test | 1515 | Ticks modelled | 13777 | Modelling quality | n/a |
| Mismatched charts errors | 2 | ||||
| Initial deposit | 10000.00 | ||||
| Total net profit | -3413.37 | Gross profit | 1588.24 | Gross loss | -5001.61 |
| Profit factor | 0.32 | Expected payoff | -426.67 | ||
| Absolute drawdown | 3573.77 | Maximal drawdown | 3860.28 (37.53%) | Relative drawdown | 37.53% (3860.28) |
| Total trades | 8 | Short positions (won %) | 6 (33.33%) | Long positions (won %) | 2 (0.00%) |
| Profit trades (% of total) | 2 (25.00%) | Loss trades (% of total) | 6 (75.00%) | ||
| Largest | profit trade | 870.91 | loss trade | -1441.43 | |
| Average | profit trade | 794.12 | loss trade | -833.60 | |
| Maximum | consecutive wins (profit in money) | 1 (870.91) | consecutive losses (loss in money) | 4 (-3320.26) | |
| Maximal | consecutive profit (count of wins) | 870.91 (1) | consecutive loss (count of losses) | -3320.26 (4) | |
| Average | consecutive wins | 1 | consecutive losses | 2 | |
| # | Time | Type | Order | Size | Price | S / L | T / P | Profit | Balance |
| 1 | 2009.12.04 14:00 | sell | 1 | 1.00 | 1.04658 | 1.05704 | 0.00000 | ||
| 2 | 2009.12.04 19:50 | s/l | 1 | 1.00 | 1.05704 | 1.05704 | 0.00000 | -989.03 | 9010.97 |
| 3 | 2009.12.04 21:00 | buy | 2 | 1.00 | 1.05960 | 1.04468 | 0.00000 | ||
| 4 | 2009.12.07 18:00 | sell | 3 | 1.00 | 1.05068 | 1.06313 | 0.00000 | ||
| 5 | 2009.12.08 19:15 | s/l | 3 | 1.00 | 1.06313 | 1.06313 | 0.00000 | -1170.53 | 7840.44 |
| 6 | 2009.12.09 18:00 | sell | 4 | 1.00 | 1.05500 | 1.06308 | 0.00000 | ||
| 7 | 2009.12.14 09:32 | s/l | 4 | 1.00 | 1.06308 | 1.06308 | 0.00000 | -761.62 | 7078.82 |
| 8 | 2009.12.15 06:00 | sell | 5 | 1.00 | 1.05559 | 1.05982 | 0.00000 | ||
| 9 | 2009.12.15 09:05 | s/l | 5 | 1.00 | 1.05982 | 1.05982 | 0.00000 | -399.08 | 6679.74 |
| 10 | 2009.12.21 12:00 | sell | 6 | 1.00 | 1.06281 | 1.06972 | 0.00000 | ||
| 11 | 2009.12.23 18:00 | modify | 6 | 1.00 | 1.06281 | 1.06281 | 0.00000 | ||
| 12 | 2009.12.23 18:00 | close | 6 | 0.50 | 1.04777 | 1.06281 | 0.00000 | 717.33 | 7397.08 |
| 13 | 2009.12.23 18:00 | sell | 7 | 0.50 | 1.06281 | 1.06281 | 0.00000 | ||
| 14 | 2009.12.24 14:20 | s/l | 2 | 1.00 | 1.04468 | 1.04468 | 0.00000 | -1441.43 | 5955.65 |
| 15 | 2009.12.30 01:00 | close | 7 | 0.50 | 1.04458 | 1.06281 | 0.00000 | 870.91 | 6826.56 |
| 16 | 2009.12.30 05:00 | buy | 8 | 1.00 | 1.04894 | 1.04243 | 0.00000 | ||
| 17 | 2009.12.31 18:57 | close at stop | 8 | 1.00 | 1.04645 | 1.04243 | 0.00000 | -239.92 | 6586.63 |