Strategy Tester Report
Starter_v4_mod_1
AlpariUK-Demo (Build 225)
| Symbol | USDCAD (US Dollar vs Canadian Dollar) | ||||
| Period | 1 Hour (H1) 2009.12.01 00:00 - 2009.12.31 18:00 (2009.12.01 - 2010.01.01) | ||||
| Model | Control points (a very crude method, the results must not be considered) | ||||
| Parameters | TakeProfit=0; Lots=1; TrailingStop=0; StopLoss=0; mm=1; Riskpercent=5; AccountIsMini=0; LiveTrading=1; DecreaseFactor=3; Margincutoff=800; Turnon=1; MaximumLosses=5; Stop=5; MAPeriod=120; | ||||
| Bars in test | 1515 | Ticks modelled | 13777 | Modelling quality | n/a |
| Mismatched charts errors | 2 | ||||
| Initial deposit | 10000.00 | ||||
| Total net profit | 487.75 | Gross profit | 870.79 | Gross loss | -383.04 |
| Profit factor | 2.27 | Expected payoff | 18.76 | ||
| Absolute drawdown | 387.84 | Maximal drawdown | 1069.99 (10.02%) | Relative drawdown | 10.02% (1069.99) |
| Total trades | 26 | Short positions (won %) | 8 (87.50%) | Long positions (won %) | 18 (94.44%) |
| Profit trades (% of total) | 24 (92.31%) | Loss trades (% of total) | 2 (7.69%) | ||
| Largest | profit trade | 108.58 | loss trade | -208.32 | |
| Average | profit trade | 36.28 | loss trade | -191.52 | |
| Maximum | consecutive wins (profit in money) | 21 (682.15) | consecutive losses (loss in money) | 1 (-208.32) | |
| Maximal | consecutive profit (count of wins) | 682.15 (21) | consecutive loss (count of losses) | -208.32 (1) | |
| Average | consecutive wins | 12 | consecutive losses | 1 | |
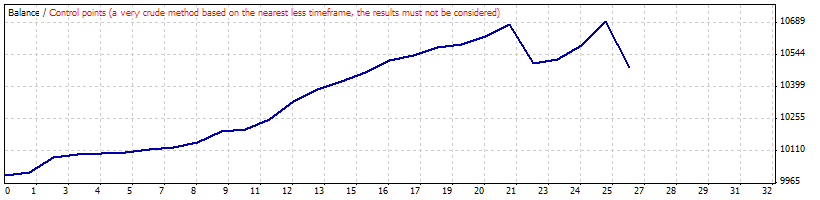
| # | Time | Type | Order | Size | Price | S / L | T / P | Profit | Balance |
| 1 | 2009.12.03 02:00 | sell | 1 | 1.00 | 1.04906 | 0.00000 | 0.00000 | ||
| 2 | 2009.12.03 03:45 | close | 1 | 1.00 | 1.04893 | 0.00000 | 0.00000 | 12.39 | 10012.39 |
| 3 | 2009.12.03 06:00 | sell | 2 | 1.00 | 1.05012 | 0.00000 | 0.00000 | ||
| 4 | 2009.12.03 07:20 | close | 2 | 1.00 | 1.04940 | 0.00000 | 0.00000 | 68.61 | 10081.00 |
| 5 | 2009.12.15 02:00 | buy | 3 | 1.00 | 1.05902 | 0.00000 | 0.00000 | ||
| 6 | 2009.12.15 02:20 | close | 3 | 1.00 | 1.05914 | 0.00000 | 0.00000 | 11.33 | 10092.33 |
| 7 | 2009.12.15 02:22 | buy | 4 | 1.00 | 1.05933 | 0.00000 | 0.00000 | ||
| 8 | 2009.12.15 09:02 | close | 4 | 1.00 | 1.05938 | 0.00000 | 0.00000 | 4.72 | 10097.05 |
| 9 | 2009.12.16 16:00 | buy | 5 | 1.00 | 1.05934 | 0.00000 | 0.00000 | ||
| 10 | 2009.12.16 16:15 | close | 5 | 1.00 | 1.05941 | 0.00000 | 0.00000 | 6.61 | 10103.66 |
| 11 | 2009.12.16 16:33 | buy | 6 | 1.00 | 1.05910 | 0.00000 | 0.00000 | ||
| 12 | 2009.12.16 17:07 | close | 6 | 1.00 | 1.05923 | 0.00000 | 0.00000 | 12.27 | 10115.93 |
| 13 | 2009.12.16 17:15 | buy | 7 | 1.00 | 1.05880 | 0.00000 | 0.00000 | ||
| 14 | 2009.12.16 17:32 | close | 7 | 1.00 | 1.05888 | 0.00000 | 0.00000 | 7.56 | 10123.49 |
| 15 | 2009.12.16 17:40 | buy | 8 | 1.00 | 1.05880 | 0.00000 | 0.00000 | ||
| 16 | 2009.12.16 18:20 | close | 8 | 1.00 | 1.05904 | 0.00000 | 0.00000 | 22.66 | 10146.15 |
| 17 | 2009.12.18 10:00 | buy | 9 | 1.00 | 1.06822 | 0.00000 | 0.00000 | ||
| 18 | 2009.12.18 10:10 | close | 9 | 1.00 | 1.06877 | 0.00000 | 0.00000 | 51.46 | 10197.61 |
| 19 | 2009.12.18 10:45 | buy | 10 | 1.00 | 1.06757 | 0.00000 | 0.00000 | ||
| 20 | 2009.12.18 10:47 | close | 10 | 1.00 | 1.06767 | 0.00000 | 0.00000 | 9.37 | 10206.98 |
| 21 | 2009.12.18 10:50 | buy | 11 | 1.00 | 1.06599 | 0.00000 | 0.00000 | ||
| 22 | 2009.12.18 10:52 | close | 11 | 1.00 | 1.06648 | 0.00000 | 0.00000 | 45.95 | 10252.93 |
| 23 | 2009.12.18 10:55 | buy | 12 | 1.00 | 1.06639 | 0.00000 | 0.00000 | ||
| 24 | 2009.12.18 10:57 | close | 12 | 1.00 | 1.06727 | 0.00000 | 0.00000 | 82.45 | 10335.38 |
| 25 | 2009.12.18 10:59 | buy | 13 | 1.00 | 1.06656 | 0.00000 | 0.00000 | ||
| 26 | 2009.12.18 11:10 | close | 13 | 1.00 | 1.06712 | 0.00000 | 0.00000 | 52.48 | 10387.86 |
| 27 | 2009.12.18 11:12 | buy | 14 | 1.00 | 1.06724 | 0.00000 | 0.00000 | ||
| 28 | 2009.12.18 11:15 | close | 14 | 1.00 | 1.06764 | 0.00000 | 0.00000 | 37.47 | 10425.33 |
| 29 | 2009.12.18 11:17 | buy | 15 | 1.00 | 1.06777 | 0.00000 | 0.00000 | ||
| 30 | 2009.12.18 11:20 | close | 15 | 1.00 | 1.06817 | 0.00000 | 0.00000 | 37.45 | 10462.78 |
| 31 | 2009.12.18 11:22 | buy | 16 | 1.00 | 1.06812 | 0.00000 | 0.00000 | ||
| 32 | 2009.12.18 16:50 | close | 16 | 1.00 | 1.06874 | 0.00000 | 0.00000 | 58.01 | 10520.79 |
| 33 | 2009.12.30 05:00 | sell | 17 | 1.00 | 1.04862 | 0.00000 | 0.00000 | ||
| 34 | 2009.12.30 08:15 | close | 17 | 1.00 | 1.04840 | 0.00000 | 0.00000 | 20.98 | 10541.77 |
| 35 | 2009.12.30 08:17 | sell | 18 | 1.00 | 1.04823 | 0.00000 | 0.00000 | ||
| 36 | 2009.12.30 08:20 | close | 18 | 1.00 | 1.04787 | 0.00000 | 0.00000 | 34.36 | 10576.13 |
| 37 | 2009.12.30 08:22 | sell | 19 | 1.00 | 1.04784 | 0.00000 | 0.00000 | ||
| 38 | 2009.12.30 08:50 | close | 19 | 1.00 | 1.04770 | 0.00000 | 0.00000 | 13.36 | 10589.49 |
| 39 | 2009.12.30 08:52 | sell | 20 | 1.00 | 1.04769 | 0.00000 | 0.00000 | ||
| 40 | 2009.12.30 09:15 | close | 20 | 1.00 | 1.04728 | 0.00000 | 0.00000 | 39.15 | 10628.64 |
| 41 | 2009.12.30 09:17 | sell | 21 | 1.00 | 1.04715 | 0.00000 | 0.00000 | ||
| 42 | 2009.12.30 09:20 | close | 21 | 1.00 | 1.04659 | 0.00000 | 0.00000 | 53.51 | 10682.15 |
| 43 | 2009.12.30 09:22 | sell | 22 | 1.00 | 1.04663 | 0.00000 | 0.00000 | ||
| 44 | 2009.12.31 12:00 | close | 22 | 1.00 | 1.04845 | 0.00000 | 0.00000 | -174.72 | 10507.43 |
| 45 | 2009.12.31 16:45 | buy | 23 | 1.00 | 1.05021 | 0.00000 | 0.00000 | ||
| 46 | 2009.12.31 16:47 | close | 23 | 1.00 | 1.05039 | 0.00000 | 0.00000 | 17.14 | 10524.57 |
| 47 | 2009.12.31 16:50 | buy | 24 | 1.00 | 1.04829 | 0.00000 | 0.00000 | ||
| 48 | 2009.12.31 16:52 | close | 24 | 1.00 | 1.04895 | 0.00000 | 0.00000 | 62.92 | 10587.49 |
| 49 | 2009.12.31 16:55 | buy | 25 | 1.00 | 1.04877 | 0.00000 | 0.00000 | ||
| 50 | 2009.12.31 16:57 | close | 25 | 1.00 | 1.04991 | 0.00000 | 0.00000 | 108.58 | 10696.07 |
| 51 | 2009.12.31 16:59 | buy | 26 | 1.00 | 1.04863 | 0.00000 | 0.00000 | ||
| 52 | 2009.12.31 18:57 | close at stop | 26 | 1.00 | 1.04645 | 0.00000 | 0.00000 | -208.32 | 10487.75 |