Strategy Tester Report
AlpariUK-Demo (Build 225)
| Symbol | USDCAD (US Dollar vs Canadian Dollar) | ||||
| Period | 1 Hour (H1) 2009.12.01 00:00 - 2009.12.31 18:00 (2009.12.01 - 2010.01.01) | ||||
| Model | Control points (a very crude method, the results must not be considered) | ||||
| Parameters | MagicNumber=0; SignalMail=false; EachTickMode=false; Lots=1; Slippage=3; StopLossMode=false; StopLoss=45; TakeProfitMode=false; TakeProfit=60; TrailingStopMode=false; TrailingStop=30; | ||||
| Bars in test | 1515 | Ticks modelled | 13777 | Modelling quality | n/a |
| Mismatched charts errors | 2 | ||||
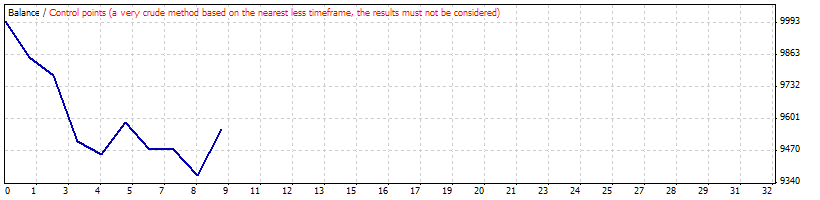
| Initial deposit | 10000.00 | ||||
| Total net profit | -440.81 | Gross profit | 323.78 | Gross loss | -764.59 |
| Profit factor | 0.42 | Expected payoff | -48.98 | ||
| Absolute drawdown | 1088.51 | Maximal drawdown | 1088.51 (10.89%) | Relative drawdown | 10.89% (1088.51) |
| Total trades | 9 | Short positions (won %) | 5 (60.00%) | Long positions (won %) | 4 (0.00%) |
| Profit trades (% of total) | 3 (33.33%) | Loss trades (% of total) | 6 (66.67%) | ||
| Largest | profit trade | 188.23 | loss trade | -271.30 | |
| Average | profit trade | 107.93 | loss trade | -127.43 | |
| Maximum | consecutive wins (profit in money) | 1 (188.23) | consecutive losses (loss in money) | 4 (-545.68) | |
| Maximal | consecutive profit (count of wins) | 188.23 (1) | consecutive loss (count of losses) | -545.68 (4) | |
| Average | consecutive wins | 1 | consecutive losses | 2 | |
| # | Time | Type | Order | Size | Price | S / L | T / P | Profit | Balance |
| 1 | 2009.12.21 00:00 | buy | 1 | 1.00 | 1.06772 | 0.00000 | 0.00000 | ||
| 2 | 2009.12.21 05:00 | close | 1 | 1.00 | 1.06616 | 0.00000 | 0.00000 | -146.32 | 9853.68 |
| 3 | 2009.12.21 07:00 | buy | 2 | 1.00 | 1.06705 | 0.00000 | 0.00000 | ||
| 4 | 2009.12.21 08:00 | close | 2 | 1.00 | 1.06627 | 0.00000 | 0.00000 | -73.15 | 9780.53 |
| 5 | 2009.12.21 09:00 | buy | 3 | 1.00 | 1.06813 | 0.00000 | 0.00000 | ||
| 6 | 2009.12.21 11:00 | close | 3 | 1.00 | 1.06524 | 0.00000 | 0.00000 | -271.30 | 9509.23 |
| 7 | 2009.12.23 04:00 | buy | 4 | 1.00 | 1.05687 | 0.00000 | 0.00000 | ||
| 8 | 2009.12.23 07:00 | close | 4 | 1.00 | 1.05629 | 0.00000 | 0.00000 | -54.91 | 9454.32 |
| 9 | 2009.12.28 15:00 | sell | 5 | 1.00 | 1.04523 | 0.00000 | 0.00000 | ||
| 10 | 2009.12.29 03:00 | close | 5 | 1.00 | 1.04383 | 0.00000 | 0.00000 | 133.65 | 9587.97 |
| 11 | 2009.12.29 10:00 | sell | 6 | 1.00 | 1.04049 | 0.00000 | 0.00000 | ||
| 12 | 2009.12.29 17:00 | close | 6 | 1.00 | 1.04166 | 0.00000 | 0.00000 | -112.32 | 9475.65 |
| 13 | 2009.12.31 02:00 | sell | 7 | 1.00 | 1.05358 | 0.00000 | 0.00000 | ||
| 14 | 2009.12.31 07:00 | close | 7 | 1.00 | 1.05356 | 0.00000 | 0.00000 | 1.90 | 9477.55 |
| 15 | 2009.12.31 08:00 | sell | 8 | 1.00 | 1.04964 | 0.00000 | 0.00000 | ||
| 16 | 2009.12.31 14:00 | close | 8 | 1.00 | 1.05076 | 0.00000 | 0.00000 | -106.59 | 9370.96 |
| 17 | 2009.12.31 16:00 | sell | 9 | 1.00 | 1.04855 | 0.00000 | 0.00000 | ||
| 18 | 2009.12.31 18:57 | close at stop | 9 | 1.00 | 1.04658 | 0.00000 | 0.00000 | 188.23 | 9559.19 |