Strategy Tester Report
AlpariUK-Demo (Build 225)
| Symbol | USDCAD (US Dollar vs Canadian Dollar) | ||||
| Period | 1 Hour (H1) 2009.12.01 00:00 - 2009.12.31 18:00 (2009.12.01 - 2010.01.01) | ||||
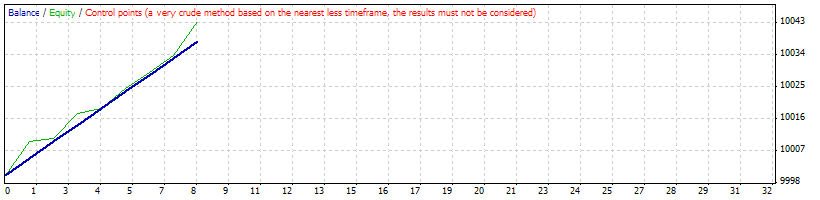
| Model | Control points (a very crude method, the results must not be considered) | ||||
| Parameters | lots=0.1; MAGIC=55; | ||||
| Bars in test | 1515 | Ticks modelled | 13777 | Modelling quality | n/a |
| Mismatched charts errors | 2 | ||||
| Initial deposit | 10000.00 | ||||
| Total net profit | 38.05 | Gross profit | 38.05 | Gross loss | 0.00 |
| Profit factor | Expected payoff | 4.76 | |||
| Absolute drawdown | 40.75 | Maximal drawdown | 40.75 (0.41%) | Relative drawdown | 0.41% (40.75) |
| Total trades | 8 | Short positions (won %) | 3 (100.00%) | Long positions (won %) | 5 (100.00%) |
| Profit trades (% of total) | 8 (100.00%) | Loss trades (% of total) | 0 (0.00%) | ||
| Largest | profit trade | 4.78 | loss trade | 0.00 | |
| Average | profit trade | 4.76 | loss trade | 0.00 | |
| Maximum | consecutive wins (profit in money) | 8 (38.05) | consecutive losses (loss in money) | 0 (0.00) | |
| Maximal | consecutive profit (count of wins) | 38.05 (8) | consecutive loss (count of losses) | 0.00 (0) | |
| Average | consecutive wins | 8 | consecutive losses | 0 | |
| # | Time | Type | Order | Size | Price | S / L | T / P | Profit | Balance |
| 1 | 2009.12.01 16:20 | buy | 1 | 0.10 | 1.04478 | 0.00000 | 1.04528 | ||
| 2 | 2009.12.01 21:33 | t/p | 1 | 0.10 | 1.04528 | 0.00000 | 1.04528 | 4.78 | 10004.78 |
| 3 | 2009.12.01 21:43 | buy | 2 | 0.10 | 1.04647 | 0.00000 | 1.04697 | ||
| 4 | 2009.12.01 21:46 | t/p | 2 | 0.10 | 1.04697 | 0.00000 | 1.04697 | 4.77 | 10009.55 |
| 5 | 2009.12.03 23:00 | sell | 3 | 0.10 | 1.05714 | 0.00000 | 1.05664 | ||
| 6 | 2009.12.04 00:20 | t/p | 3 | 0.10 | 1.05664 | 0.00000 | 1.05664 | 4.73 | 10014.28 |
| 7 | 2009.12.08 05:00 | buy | 4 | 0.10 | 1.05068 | 0.00000 | 1.05118 | ||
| 8 | 2009.12.08 05:32 | t/p | 4 | 0.10 | 1.05118 | 0.00000 | 1.05118 | 4.75 | 10019.03 |
| 9 | 2009.12.14 06:20 | sell | 5 | 0.10 | 1.05828 | 0.00000 | 1.05778 | ||
| 10 | 2009.12.14 06:25 | t/p | 5 | 0.10 | 1.05778 | 0.00000 | 1.05778 | 4.73 | 10023.76 |
| 11 | 2009.12.15 06:00 | buy | 6 | 0.10 | 1.05585 | 0.00000 | 1.05635 | ||
| 12 | 2009.12.15 06:15 | t/p | 6 | 0.10 | 1.05635 | 0.00000 | 1.05635 | 4.73 | 10028.49 |
| 13 | 2009.12.29 03:12 | buy | 7 | 0.10 | 1.04362 | 0.00000 | 1.04412 | ||
| 14 | 2009.12.29 03:45 | t/p | 7 | 0.10 | 1.04412 | 0.00000 | 1.04412 | 4.78 | 10033.27 |
| 15 | 2009.12.30 09:00 | sell | 8 | 0.10 | 1.04766 | 0.00000 | 1.04716 | ||
| 16 | 2009.12.30 09:20 | t/p | 8 | 0.10 | 1.04716 | 0.00000 | 1.04716 | 4.78 | 10038.05 |