Strategy Tester Report
MA_Angle_EA
AlpariUK-Demo (Build 225)
| Symbol | USDCAD (US Dollar vs Canadian Dollar) | ||||
| Period | 1 Hour (H1) 2009.12.01 00:00 - 2009.12.31 18:00 (2009.12.01 - 2010.01.01) | ||||
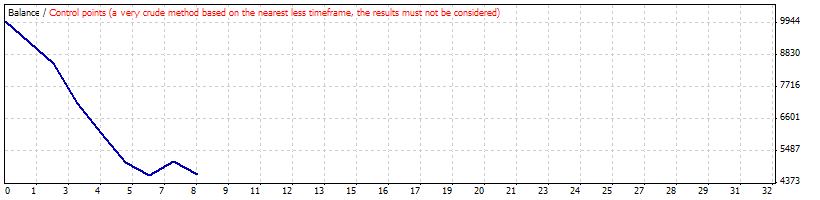
| Model | Control points (a very crude method, the results must not be considered) | ||||
| Parameters | Debug=false; AccountIsMini=false; MoneyManagement=false; TradeSizePercent=10; Lots=0.1; MaxLots=30; StopLoss=0; UseTrailingStop=false; TrailingStopType=1; TrailingStop=20; Slippage=10; TakeProfit=0; Margincutoff=800; MA_Period=34; m=""--Moving"; m0="""; m1="""; m2="""; m3="""; m4="""; MA_Type=1; p=""--Applied"; p0="""; p1="""; p2="""; p3="""; p4="""; p5="""; p6="""; MA_AppliedPrice=4; Angle_Threshold=15; PrevMAShift=4; CurMAShift=0; | ||||
| Bars in test | 1515 | Ticks modelled | 13777 | Modelling quality | n/a |
| Mismatched charts errors | 2 | ||||
| Initial deposit | 10000.00 | ||||
| Total net profit | -5331.27 | Gross profit | 465.69 | Gross loss | -5796.95 |
| Profit factor | 0.08 | Expected payoff | -666.41 | ||
| Absolute drawdown | 6076.62 | Maximal drawdown | 6671.41 (62.97%) | Relative drawdown | 62.97% (6671.41) |
| Total trades | 8 | Short positions (won %) | 4 (25.00%) | Long positions (won %) | 4 (0.00%) |
| Profit trades (% of total) | 1 (12.50%) | Loss trades (% of total) | 7 (87.50%) | ||
| Largest | profit trade | 465.69 | loss trade | -1378.80 | |
| Average | profit trade | 465.69 | loss trade | -828.14 | |
| Maximum | consecutive wins (profit in money) | 1 (465.69) | consecutive losses (loss in money) | 6 (-5359.22) | |
| Maximal | consecutive profit (count of wins) | 465.69 (1) | consecutive loss (count of losses) | -5359.22 (6) | |
| Average | consecutive wins | 1 | consecutive losses | 4 | |
| # | Time | Type | Order | Size | Price | S / L | T / P | Profit | Balance |
| 1 | 2009.12.01 10:00 | sell | 1 | 1.00 | 1.04689 | 0.00000 | 0.00000 | ||
| 2 | 2009.12.03 17:00 | close | 1 | 1.00 | 1.05453 | 0.00000 | 0.00000 | -725.99 | 9274.01 |
| 3 | 2009.12.03 17:00 | buy | 2 | 1.00 | 1.05453 | 0.00000 | 0.00000 | ||
| 4 | 2009.12.04 16:00 | close | 2 | 1.00 | 1.04673 | 0.00000 | 0.00000 | -745.84 | 8528.17 |
| 5 | 2009.12.04 16:00 | sell | 3 | 1.00 | 1.04673 | 0.00000 | 0.00000 | ||
| 6 | 2009.12.07 12:00 | close | 3 | 1.00 | 1.06136 | 0.00000 | 0.00000 | -1378.80 | 7149.37 |
| 7 | 2009.12.07 12:00 | buy | 4 | 1.00 | 1.06136 | 0.00000 | 0.00000 | ||
| 8 | 2009.12.10 14:00 | close | 4 | 1.00 | 1.05017 | 0.00000 | 0.00000 | -1068.83 | 6080.54 |
| 9 | 2009.12.10 14:00 | sell | 5 | 1.00 | 1.05017 | 0.00000 | 0.00000 | ||
| 10 | 2009.12.11 20:00 | close | 5 | 1.00 | 1.06065 | 0.00000 | 0.00000 | -988.45 | 5092.10 |
| 11 | 2009.12.11 20:00 | buy | 6 | 1.00 | 1.06065 | 0.00000 | 0.00000 | ||
| 12 | 2009.12.21 14:00 | close | 6 | 1.00 | 1.05594 | 0.00000 | 0.00000 | -451.31 | 4640.78 |
| 13 | 2009.12.21 14:00 | sell | 7 | 1.00 | 1.05594 | 0.00000 | 0.00000 | ||
| 14 | 2009.12.30 07:00 | close | 7 | 1.00 | 1.05101 | 0.00000 | 0.00000 | 465.69 | 5106.47 |
| 15 | 2009.12.30 07:00 | buy | 8 | 1.00 | 1.05101 | 0.00000 | 0.00000 | ||
| 16 | 2009.12.31 18:57 | close at stop | 8 | 1.00 | 1.04645 | 0.00000 | 0.00000 | -437.73 | 4668.73 |