Strategy Tester Report
AlpariUK-Demo (Build 225)
| Symbol | EURUSD (Euro vs US Dollar) | ||||
| Period | 1 Hour (H1) 2009.08.03 01:00 - 2009.10.01 00:00 (2009.08.01 - 2009.10.01) | ||||
| Model | Control points (a very crude method, the results must not be considered) | ||||
| Parameters | breakeven=15; addbreak=4; MagicNumber=222; SignalMail=false; EachTickMode=false; Lots=0.1; Slippage=2; UseStopLoss=false; StopLoss=30; UseTakeProfit=false; TakeProfit=20; UseTrailingStop=false; TrailingStop=15; UseDayOfWeek=false; FromDayTrade=1; ToDayTrade=5; | ||||
| Bars in test | 1124 | Ticks modelled | 25909 | Modelling quality | n/a |
| Mismatched charts errors | 7 | ||||
| Initial deposit | 10000.00 | ||||
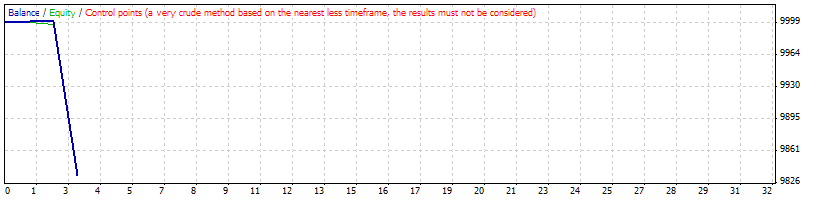
| Total net profit | -165.74 | Gross profit | 0.80 | Gross loss | -166.54 |
| Profit factor | 0.00 | Expected payoff | -55.25 | ||
| Absolute drawdown | 370.85 | Maximal drawdown | 386.65 (3.86%) | Relative drawdown | 3.86% (386.65) |
| Total trades | 3 | Short positions (won %) | 1 (0.00%) | Long positions (won %) | 2 (100.00%) |
| Profit trades (% of total) | 2 (66.67%) | Loss trades (% of total) | 1 (33.33%) | ||
| Largest | profit trade | 0.40 | loss trade | -166.54 | |
| Average | profit trade | 0.40 | loss trade | -166.54 | |
| Maximum | consecutive wins (profit in money) | 2 (0.80) | consecutive losses (loss in money) | 1 (-166.54) | |
| Maximal | consecutive profit (count of wins) | 0.80 (2) | consecutive loss (count of losses) | -166.54 (1) | |
| Average | consecutive wins | 2 | consecutive losses | 1 | |
| # | Time | Type | Order | Size | Price | S / L | T / P | Profit | Balance |
| 1 | 2009.08.07 18:00 | buy | 1 | 0.10 | 1.41806 | 0.00000 | 0.00000 | ||
| 2 | 2009.08.07 18:50 | modify | 1 | 0.10 | 1.41806 | 1.41810 | 0.00000 | ||
| 3 | 2009.08.07 18:57 | s/l | 1 | 0.10 | 1.41810 | 1.41810 | 0.00000 | 0.40 | 10000.40 |
| 4 | 2009.08.07 19:00 | buy | 2 | 0.10 | 1.41833 | 0.00000 | 0.00000 | ||
| 5 | 2009.08.07 19:10 | modify | 2 | 0.10 | 1.41833 | 1.41837 | 0.00000 | ||
| 6 | 2009.08.07 19:46 | s/l | 2 | 0.10 | 1.41837 | 1.41837 | 0.00000 | 0.40 | 10000.80 |
| 7 | 2009.09.08 13:00 | sell | 3 | 0.10 | 1.44761 | 0.00000 | 0.00000 | ||
| 8 | 2009.09.30 23:59 | close at stop | 3 | 0.10 | 1.46389 | 0.00000 | 0.00000 | -166.54 | 9834.26 |