Strategy Tester Report
AlpariUK-Demo (Build 225)
| Symbol | EURUSD (Euro vs US Dollar) | ||||
| Period | 1 Hour (H1) 2009.08.03 01:00 - 2009.10.01 00:00 (2009.08.01 - 2009.10.01) | ||||
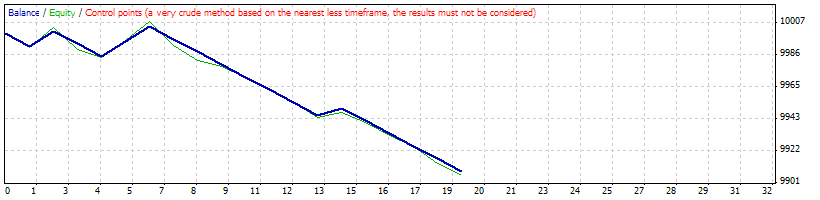
| Model | Control points (a very crude method, the results must not be considered) | ||||
| Parameters | MAGIC=363278; PARAMETERS_TRADE=""PARAMETERS"; Lots=0.1; Slippage=4; lStopLoss=60; sStopLoss=60; lTakeProfit=100; sTakeProfit=100; lTrailingStop=50; sTrailingStop=50; PARAMETERS_EXPERT=""PARAMETERS"; clOpenBuy=Black; clCloseBuy=Black; clOpenSell=Black; clCloseSell=Black; clModiBuy=Black; clModiSell=Black; Name_Expert=""easyLMA""; UseSound=false; NameFileSound=""alert.wav""; UseHourTrade=false; FromHourTrade=8; ToHourTrade=19; PARAMETERS_INDICATOR_ONE=""Moving"; MAsmallMode=1; MAsmall=55; MAbig=200; MAbigMode=1; PARAMETERS_INDICATOR_TWO=""Stochastic""; KPeriod=14; DPeriod=5; Slowing=5; PARAMETERS_INDICATOR_THREE=""Parabolic"; Step=0.008; Maximum=0.05; PARAMETERS_INDICATOR_FOUR=""Parabolic"; Step2=0.02; Maximum2=0.2; PARAMETERS_INDICATOR_FIVE=""I_XO_A_H""; BoxSize=34; | ||||
| Bars in test | 1124 | Ticks modelled | 25909 | Modelling quality | n/a |
| Mismatched charts errors | 7 | ||||
| Initial deposit | 10000.00 | ||||
| Total net profit | -91.50 | Gross profit | 34.50 | Gross loss | -126.00 |
| Profit factor | 0.27 | Expected payoff | -4.82 | ||
| Absolute drawdown | 91.50 | Maximal drawdown | 96.30 (0.96%) | Relative drawdown | 0.96% (96.30) |
| Total trades | 19 | Short positions (won %) | 5 (0.00%) | Long positions (won %) | 14 (28.57%) |
| Profit trades (% of total) | 4 (21.05%) | Loss trades (% of total) | 15 (78.95%) | ||
| Largest | profit trade | 10.00 | loss trade | -8.40 | |
| Average | profit trade | 8.63 | loss trade | -8.40 | |
| Maximum | consecutive wins (profit in money) | 2 (20.00) | consecutive losses (loss in money) | 7 (-58.80) | |
| Maximal | consecutive profit (count of wins) | 20.00 (2) | consecutive loss (count of losses) | -58.80 (7) | |
| Average | consecutive wins | 1 | consecutive losses | 4 | |
| # | Time | Type | Order | Size | Price | S / L | T / P | Profit | Balance |
| 1 | 2009.08.03 13:00 | buy | 1 | 0.10 | 1.42940 | 1.42856 | 1.43040 | ||
| 2 | 2009.08.03 13:07 | s/l | 1 | 0.10 | 1.42856 | 1.42856 | 1.43040 | -8.40 | 9991.60 |
| 3 | 2009.08.03 13:10 | buy | 2 | 0.10 | 1.42996 | 1.42912 | 1.43096 | ||
| 4 | 2009.08.03 13:15 | modify | 2 | 0.10 | 1.42996 | 1.42997 | 1.43096 | ||
| 5 | 2009.08.03 13:20 | t/p | 2 | 0.10 | 1.43096 | 1.42997 | 1.43096 | 10.00 | 10001.60 |
| 6 | 2009.08.03 13:20 | buy | 3 | 0.10 | 1.43145 | 1.43061 | 1.43245 | ||
| 7 | 2009.08.03 13:27 | s/l | 3 | 0.10 | 1.43061 | 1.43061 | 1.43245 | -8.40 | 9993.20 |
| 8 | 2009.08.03 13:27 | buy | 4 | 0.10 | 1.43046 | 1.42962 | 1.43146 | ||
| 9 | 2009.08.03 13:37 | s/l | 4 | 0.10 | 1.42962 | 1.42962 | 1.43146 | -8.40 | 9984.80 |
| 10 | 2009.08.03 13:37 | buy | 5 | 0.10 | 1.42979 | 1.42895 | 1.43079 | ||
| 11 | 2009.08.03 13:40 | t/p | 5 | 0.10 | 1.43079 | 1.42895 | 1.43079 | 10.00 | 9994.80 |
| 12 | 2009.08.03 13:40 | buy | 6 | 0.10 | 1.43110 | 1.43026 | 1.43210 | ||
| 13 | 2009.08.03 13:45 | modify | 6 | 0.10 | 1.43110 | 1.43114 | 1.43210 | ||
| 14 | 2009.08.03 13:50 | t/p | 6 | 0.10 | 1.43210 | 1.43114 | 1.43210 | 10.00 | 10004.80 |
| 15 | 2009.08.03 13:50 | buy | 7 | 0.10 | 1.43267 | 1.43183 | 1.43367 | ||
| 16 | 2009.08.03 13:57 | s/l | 7 | 0.10 | 1.43183 | 1.43183 | 1.43367 | -8.40 | 9996.40 |
| 17 | 2009.08.03 13:57 | buy | 8 | 0.10 | 1.43162 | 1.43078 | 1.43262 | ||
| 18 | 2009.08.03 14:02 | s/l | 8 | 0.10 | 1.43078 | 1.43078 | 1.43262 | -8.40 | 9988.00 |
| 19 | 2009.08.14 21:00 | sell | 9 | 0.10 | 1.41704 | 1.41788 | 1.41604 | ||
| 20 | 2009.08.14 21:10 | s/l | 9 | 0.10 | 1.41788 | 1.41788 | 1.41604 | -8.40 | 9979.60 |
| 21 | 2009.08.14 21:26 | sell | 10 | 0.10 | 1.41757 | 1.41841 | 1.41657 | ||
| 22 | 2009.08.14 21:40 | s/l | 10 | 0.10 | 1.41841 | 1.41841 | 1.41657 | -8.40 | 9971.20 |
| 23 | 2009.08.20 18:00 | buy | 11 | 0.10 | 1.42362 | 1.42278 | 1.42462 | ||
| 24 | 2009.08.20 18:15 | s/l | 11 | 0.10 | 1.42278 | 1.42278 | 1.42462 | -8.40 | 9962.80 |
| 25 | 2009.08.20 18:17 | buy | 12 | 0.10 | 1.42307 | 1.42223 | 1.42407 | ||
| 26 | 2009.08.20 18:20 | s/l | 12 | 0.10 | 1.42223 | 1.42223 | 1.42407 | -8.40 | 9954.40 |
| 27 | 2009.08.20 18:27 | buy | 13 | 0.10 | 1.42337 | 1.42253 | 1.42437 | ||
| 28 | 2009.08.20 18:37 | s/l | 13 | 0.10 | 1.42253 | 1.42253 | 1.42437 | -8.40 | 9946.00 |
| 29 | 2009.08.20 18:40 | buy | 14 | 0.10 | 1.42362 | 1.42278 | 1.42462 | ||
| 30 | 2009.08.20 18:50 | modify | 14 | 0.10 | 1.42362 | 1.42407 | 1.42462 | ||
| 31 | 2009.08.20 18:57 | s/l | 14 | 0.10 | 1.42407 | 1.42407 | 1.42462 | 4.50 | 9950.50 |
| 32 | 2009.08.20 18:57 | buy | 15 | 0.10 | 1.42401 | 1.42317 | 1.42501 | ||
| 33 | 2009.08.20 19:07 | s/l | 15 | 0.10 | 1.42317 | 1.42317 | 1.42501 | -8.40 | 9942.10 |
| 34 | 2009.09.02 05:02 | sell | 16 | 0.10 | 1.42057 | 1.42141 | 1.41957 | ||
| 35 | 2009.09.02 05:15 | s/l | 16 | 0.10 | 1.42141 | 1.42141 | 1.41957 | -8.40 | 9933.70 |
| 36 | 2009.09.07 03:00 | buy | 17 | 0.10 | 1.43270 | 1.43186 | 1.43370 | ||
| 37 | 2009.09.07 04:02 | s/l | 17 | 0.10 | 1.43186 | 1.43186 | 1.43370 | -8.40 | 9925.30 |
| 38 | 2009.09.28 07:02 | sell | 18 | 0.10 | 1.45831 | 1.45915 | 1.45731 | ||
| 39 | 2009.09.28 07:10 | s/l | 18 | 0.10 | 1.45915 | 1.45915 | 1.45731 | -8.40 | 9916.90 |
| 40 | 2009.09.28 07:50 | sell | 19 | 0.10 | 1.45818 | 1.45902 | 1.45718 | ||
| 41 | 2009.09.28 07:57 | s/l | 19 | 0.10 | 1.45902 | 1.45902 | 1.45718 | -8.40 | 9908.50 |