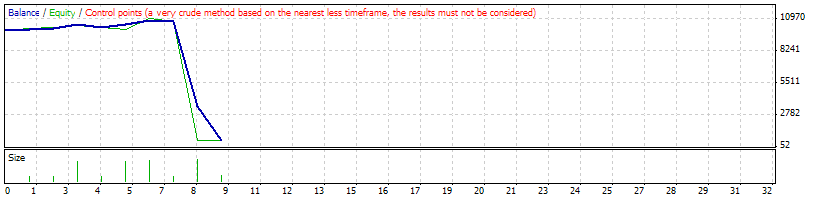
Strategy Tester Report
AlpariUK-Demo (Build 225)
| Symbol | EURUSD (Euro vs US Dollar) | ||||
| Period | 1 Hour (H1) 2009.08.03 01:00 - 2009.10.01 00:00 (2009.08.01 - 2009.10.01) | ||||
| Model | Control points (a very crude method, the results must not be considered) | ||||
| Parameters | Note1=""TF"; | ||||
| Bars in test | 1124 | Ticks modelled | 25909 | Modelling quality | n/a |
| Mismatched charts errors | 7 | ||||
| Initial deposit | 10000.00 | ||||
| Total net profit | -9424.61 | Gross profit | 1128.80 | Gross loss | -10553.41 |
| Profit factor | 0.11 | Expected payoff | -1047.18 | ||
| Absolute drawdown | 9424.61 | Maximal drawdown | 10203.72 (94.66%) | Relative drawdown | 94.66% (10203.72) |
| Total trades | 9 | Short positions (won %) | 2 (0.00%) | Long positions (won %) | 7 (71.43%) |
| Profit trades (% of total) | 5 (55.56%) | Loss trades (% of total) | 4 (44.44%) | ||
| Largest | profit trade | 315.60 | loss trade | -7245.00 | |
| Average | profit trade | 225.76 | loss trade | -2638.35 | |
| Maximum | consecutive wins (profit in money) | 3 (506.80) | consecutive losses (loss in money) | 3 (-10265.26) | |
| Maximal | consecutive profit (count of wins) | 622.00 (2) | consecutive loss (count of losses) | -10265.26 (3) | |
| Average | consecutive wins | 3 | consecutive losses | 2 | |
| # | Time | Type | Order | Size | Price | S / L | T / P | Profit | Balance |
| 1 | 2009.08.03 01:00 | buy | 1 | 2.50 | 1.42514 | 0.00000 | 1.42554 | ||
| 2 | 2009.08.03 01:05 | t/p | 1 | 2.50 | 1.42554 | 0.00000 | 1.42554 | 100.00 | 10100.00 |
| 3 | 2009.08.03 02:00 | buy | 2 | 2.52 | 1.42872 | 0.00000 | 1.42912 | ||
| 4 | 2009.08.03 02:07 | t/p | 2 | 2.52 | 1.42912 | 0.00000 | 1.42912 | 100.80 | 10200.80 |
| 5 | 2009.08.03 03:20 | buy | 3 | 2.55 | 1.42596 | 0.00000 | 1.42636 | ||
| 6 | 2009.08.03 04:00 | buy | 4 | 7.65 | 1.42419 | 0.00000 | 1.42459 | ||
| 7 | 2009.08.03 04:45 | t/p | 4 | 7.65 | 1.42459 | 0.00000 | 1.42459 | 306.00 | 10506.80 |
| 8 | 2009.08.03 04:45 | close | 3 | 2.55 | 1.42483 | 0.00000 | 1.42636 | -288.15 | 10218.65 |
| 9 | 2009.08.03 05:02 | buy | 5 | 2.55 | 1.42587 | 0.00000 | 1.42627 | ||
| 10 | 2009.08.03 06:00 | buy | 6 | 7.66 | 1.42348 | 0.00000 | 1.42388 | ||
| 11 | 2009.08.03 06:03 | t/p | 6 | 7.66 | 1.42388 | 0.00000 | 1.42388 | 306.40 | 10525.05 |
| 12 | 2009.08.03 07:00 | buy | 7 | 7.89 | 1.42467 | 0.00000 | 1.42507 | ||
| 13 | 2009.08.03 08:37 | t/p | 7 | 7.89 | 1.42507 | 0.00000 | 1.42507 | 315.60 | 10840.65 |
| 14 | 2009.08.03 08:37 | close | 5 | 2.55 | 1.42545 | 0.00000 | 1.42627 | -107.10 | 10733.55 |
| 15 | 2009.08.03 09:00 | sell | 8 | 2.68 | 1.42086 | 0.00000 | 1.42046 | ||
| 16 | 2009.08.03 10:00 | sell | 9 | 8.05 | 1.42273 | 0.00000 | 1.42233 | ||
| 17 | 2009.08.03 13:45 | close at stop | 9 | 8.05 | 1.43173 | 0.00000 | 1.42233 | -7245.00 | 3488.55 |
| 18 | 2009.08.03 13:45 | close at stop | 8 | 2.68 | 1.43173 | 0.00000 | 1.42046 | -2913.16 | 575.39 |