Strategy Tester Report
AlpariUK-Demo (Build 225)
| Symbol | EURUSD (Euro vs US Dollar) | ||||
| Period | 1 Hour (H1) 2009.08.03 01:00 - 2009.10.01 00:00 (2009.08.01 - 2009.10.01) | ||||
| Model | Control points (a very crude method, the results must not be considered) | ||||
| Parameters | MagicNumber=0; EachTickMode=false; Lots=0.1; Slippage=3; StopLossMode=false; StopLoss=100; TakeProfitMode=false; TakeProfit=100; TrailingStopMode=false; TrailingStop=30; | ||||
| Bars in test | 1124 | Ticks modelled | 25909 | Modelling quality | n/a |
| Mismatched charts errors | 7 | ||||
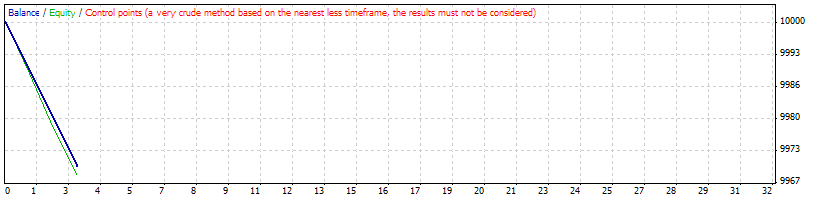
| Initial deposit | 10000.00 | ||||
| Total net profit | -30.00 | Gross profit | 0.00 | Gross loss | -30.00 |
| Profit factor | 0.00 | Expected payoff | -10.00 | ||
| Absolute drawdown | 30.00 | Maximal drawdown | 30.00 (0.30%) | Relative drawdown | 0.30% (30.00) |
| Total trades | 3 | Short positions (won %) | 3 (0.00%) | Long positions (won %) | 0 (0.00%) |
| Profit trades (% of total) | 0 (0.00%) | Loss trades (% of total) | 3 (100.00%) | ||
| Largest | profit trade | 0.00 | loss trade | -10.00 | |
| Average | profit trade | 0.00 | loss trade | -10.00 | |
| Maximum | consecutive wins (profit in money) | 0 (0.00) | consecutive losses (loss in money) | 3 (-30.00) | |
| Maximal | consecutive profit (count of wins) | 0.00 (0) | consecutive loss (count of losses) | -30.00 (3) | |
| Average | consecutive wins | 0 | consecutive losses | 3 | |
| # | Time | Type | Order | Size | Price | S / L | T / P | Profit | Balance |
| 1 | 2009.08.14 22:00 | sell | 1 | 0.10 | 1.41887 | 1.41987 | 1.41787 | ||
| 2 | 2009.08.14 22:40 | s/l | 1 | 0.10 | 1.41987 | 1.41987 | 1.41787 | -10.00 | 9990.00 |
| 3 | 2009.09.02 06:00 | sell | 2 | 0.10 | 1.42120 | 1.42220 | 1.42020 | ||
| 4 | 2009.09.02 06:20 | s/l | 2 | 0.10 | 1.42220 | 1.42220 | 1.42020 | -10.00 | 9980.00 |
| 5 | 2009.09.28 08:00 | sell | 3 | 0.10 | 1.45920 | 1.46020 | 1.45820 | ||
| 6 | 2009.09.28 08:10 | s/l | 3 | 0.10 | 1.46020 | 1.46020 | 1.45820 | -10.00 | 9970.00 |