Strategy Tester Report
AlpariUK-Demo (Build 225)
| Symbol | EURUSD (Euro vs US Dollar) | ||||
| Period | 1 Hour (H1) 2009.08.03 01:00 - 2009.10.01 00:00 (2009.08.01 - 2009.10.01) | ||||
| Model | Control points (a very crude method, the results must not be considered) | ||||
| Parameters | lStopLoss=500; sStopLoss=500; lTakeProfit=40; sTakeProfit=40; lTrailingStop=500; sTrailingStop=500; clOpenBuy=Black; clCloseBuy=Black; clOpenSell=Black; clCloseSell=Black; clModiBuy=Black; clModiSell=Black; Name_Expert=""ABBMD"; Slippage=5; UseSound=false; NameFileSound=""alert.wav""; Lots=0.1; Margin_Level=500; WilliamsH1_BUY=10; WilliamsH1_SELL=-200; WilliamsM30_BUY=10; WilliamsM30_SELL=-200; WilliamsM15_BUY=10; WilliamsM15_SELL=-200; WilliamsM5_BUY=-70; WilliamsM5_SELL=-30; RSIH1_BUY=75; RSIH1_SELL=25; RSIH4_BUY=99; RSIH4_SELL=11; RSID1_BUY=99; RSID1_SELL=11; MACDH4_BUY_FastEma=15; MACDH4_BUY_SlowEma=35; MACDH4_BUY_SMA=12; MACDH4_SELL_FastEma=15; MACDH4_SELL_SlowEma=35; MACDH4_SELL_SMA=12; MACDD1_BUY_FastEma=15; MACDD1_BUY_SlowEma=35; MACDD1_BUY_SMA=12; MACDD1_SELL_FastEma=15; MACDD1_SELL_SlowEma=35; MACDD1_SELL_SMA=12; BEARS=15; BULLS=15; FastMA=24; SlowMA=24; CLOSE_FastEma=15; CLOSE_SlowEma=35; CLOSE_SMA=12; CLOSE_RSI_LevelBUY=70; Close_RSI_LevelSELL=30; Close_RSI_Period=21; _Parameters_b_Lots=""Ïàðàìåòðû"; LotsWayChoice=1; LotsPercent=40; LotsDeltaDepo=500; LotsDepoForOne=500; LotsMax=1000; | ||||
| Bars in test | 1124 | Ticks modelled | 25909 | Modelling quality | n/a |
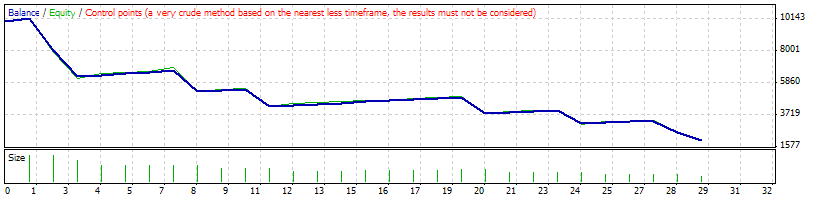
| Mismatched charts errors | 7 | ||||
| Initial deposit | 10000.00 | ||||
| Total net profit | -8000.28 | Gross profit | 1703.58 | Gross loss | -9703.86 |
| Profit factor | 0.18 | Expected payoff | -275.87 | ||
| Absolute drawdown | 8000.28 | Maximal drawdown | 8160.28 (80.32%) | Relative drawdown | 80.32% (8160.28) |
| Total trades | 29 | Short positions (won %) | 29 (72.41%) | Long positions (won %) | 0 (0.00%) |
| Profit trades (% of total) | 21 (72.41%) | Loss trades (% of total) | 8 (27.59%) | ||
| Largest | profit trade | 160.00 | loss trade | -2155.37 | |
| Average | profit trade | 81.12 | loss trade | -1212.98 | |
| Maximum | consecutive wins (profit in money) | 8 (600.00) | consecutive losses (loss in money) | 2 (-3884.57) | |
| Maximal | consecutive profit (count of wins) | 600.00 (8) | consecutive loss (count of losses) | -3884.57 (2) | |
| Average | consecutive wins | 4 | consecutive losses | 1 | |
| # | Time | Type | Order | Size | Price | S / L | T / P | Profit | Balance |
| 1 | 2009.08.10 20:20 | sell | 1 | 4.00 | 1.41237 | 1.41761 | 1.41197 | ||
| 2 | 2009.08.10 20:27 | t/p | 1 | 4.00 | 1.41197 | 1.41761 | 1.41197 | 160.00 | 10160.00 |
| 3 | 2009.08.10 20:40 | sell | 2 | 4.10 | 1.41243 | 1.41767 | 1.41203 | ||
| 4 | 2009.08.11 09:15 | s/l | 2 | 4.10 | 1.41767 | 1.41767 | 1.41203 | -2155.37 | 8004.63 |
| 5 | 2009.08.11 15:50 | sell | 3 | 3.30 | 1.41127 | 1.41651 | 1.41087 | ||
| 6 | 2009.08.11 18:20 | s/l | 3 | 3.30 | 1.41651 | 1.41651 | 1.41087 | -1729.20 | 6275.43 |
| 7 | 2009.08.11 18:20 | sell | 4 | 2.60 | 1.41657 | 1.42181 | 1.41617 | ||
| 8 | 2009.08.11 18:27 | t/p | 4 | 2.60 | 1.41617 | 1.42181 | 1.41617 | 104.00 | 6379.43 |
| 9 | 2009.08.11 18:27 | sell | 5 | 2.60 | 1.41556 | 1.42080 | 1.41516 | ||
| 10 | 2009.08.11 19:50 | t/p | 5 | 2.60 | 1.41516 | 1.42080 | 1.41516 | 104.00 | 6483.43 |
| 11 | 2009.08.11 19:50 | sell | 6 | 2.60 | 1.41467 | 1.41991 | 1.41427 | ||
| 12 | 2009.08.12 04:50 | t/p | 6 | 2.60 | 1.41427 | 1.41991 | 1.41427 | 99.58 | 6583.01 |
| 13 | 2009.08.12 09:15 | sell | 7 | 2.70 | 1.41015 | 1.41539 | 1.40975 | ||
| 14 | 2009.08.12 09:20 | t/p | 7 | 2.70 | 1.40975 | 1.41539 | 1.40975 | 108.00 | 6691.01 |
| 15 | 2009.08.12 09:20 | sell | 8 | 2.70 | 1.40878 | 1.41402 | 1.40838 | ||
| 16 | 2009.08.12 11:20 | s/l | 8 | 2.70 | 1.41402 | 1.41402 | 1.40838 | -1414.80 | 5276.21 |
| 17 | 2009.08.12 11:20 | sell | 9 | 2.20 | 1.41378 | 1.41902 | 1.41338 | ||
| 18 | 2009.08.12 11:27 | t/p | 9 | 2.20 | 1.41338 | 1.41902 | 1.41338 | 88.00 | 5364.21 |
| 19 | 2009.08.12 11:27 | sell | 10 | 2.20 | 1.41280 | 1.41804 | 1.41240 | ||
| 20 | 2009.08.12 11:37 | t/p | 10 | 2.20 | 1.41240 | 1.41804 | 1.41240 | 88.00 | 5452.21 |
| 21 | 2009.08.12 11:37 | sell | 11 | 2.20 | 1.41212 | 1.41736 | 1.41172 | ||
| 22 | 2009.08.12 13:02 | s/l | 11 | 2.20 | 1.41736 | 1.41736 | 1.41172 | -1152.80 | 4299.41 |
| 23 | 2009.08.17 10:07 | sell | 12 | 1.80 | 1.41067 | 1.41591 | 1.41027 | ||
| 24 | 2009.08.17 11:20 | t/p | 12 | 1.80 | 1.41027 | 1.41591 | 1.41027 | 72.00 | 4371.41 |
| 25 | 2009.08.17 11:20 | sell | 13 | 1.80 | 1.40923 | 1.41447 | 1.40883 | ||
| 26 | 2009.08.17 12:15 | t/p | 13 | 1.80 | 1.40883 | 1.41447 | 1.40883 | 72.00 | 4443.41 |
| 27 | 2009.08.17 12:15 | sell | 14 | 1.80 | 1.40806 | 1.41330 | 1.40766 | ||
| 28 | 2009.08.17 12:20 | t/p | 14 | 1.80 | 1.40766 | 1.41330 | 1.40766 | 72.00 | 4515.41 |
| 29 | 2009.08.17 12:27 | sell | 15 | 1.90 | 1.40806 | 1.41330 | 1.40766 | ||
| 30 | 2009.08.17 12:27 | t/p | 15 | 1.90 | 1.40766 | 1.41330 | 1.40766 | 76.00 | 4591.41 |
| 31 | 2009.08.17 13:20 | sell | 16 | 1.90 | 1.40688 | 1.41212 | 1.40648 | ||
| 32 | 2009.08.17 13:27 | t/p | 16 | 1.90 | 1.40648 | 1.41212 | 1.40648 | 76.00 | 4667.41 |
| 33 | 2009.08.17 13:27 | sell | 17 | 1.90 | 1.40668 | 1.41192 | 1.40628 | ||
| 34 | 2009.08.17 13:45 | t/p | 17 | 1.90 | 1.40628 | 1.41192 | 1.40628 | 76.00 | 4743.41 |
| 35 | 2009.08.17 14:10 | sell | 18 | 1.90 | 1.40623 | 1.41147 | 1.40583 | ||
| 36 | 2009.08.17 16:15 | t/p | 18 | 1.90 | 1.40583 | 1.41147 | 1.40583 | 76.00 | 4819.41 |
| 37 | 2009.08.17 16:15 | sell | 19 | 2.00 | 1.40535 | 1.41059 | 1.40495 | ||
| 38 | 2009.08.17 16:20 | t/p | 19 | 2.00 | 1.40495 | 1.41059 | 1.40495 | 80.00 | 4899.41 |
| 39 | 2009.08.17 16:20 | sell | 20 | 2.00 | 1.40448 | 1.40972 | 1.40408 | ||
| 40 | 2009.08.17 20:20 | s/l | 20 | 2.00 | 1.40972 | 1.40972 | 1.40408 | -1048.00 | 3851.41 |
| 41 | 2009.08.17 20:20 | sell | 21 | 1.60 | 1.40949 | 1.41473 | 1.40909 | ||
| 42 | 2009.08.17 20:40 | t/p | 21 | 1.60 | 1.40909 | 1.41473 | 1.40909 | 64.00 | 3915.41 |
| 43 | 2009.08.17 20:40 | sell | 22 | 1.60 | 1.40867 | 1.41391 | 1.40827 | ||
| 44 | 2009.08.17 20:50 | t/p | 22 | 1.60 | 1.40827 | 1.41391 | 1.40827 | 64.00 | 3979.41 |
| 45 | 2009.08.17 20:50 | sell | 23 | 1.60 | 1.40777 | 1.41301 | 1.40737 | ||
| 46 | 2009.08.17 23:45 | t/p | 23 | 1.60 | 1.40737 | 1.41301 | 1.40737 | 64.00 | 4043.41 |
| 47 | 2009.08.17 23:45 | sell | 24 | 1.70 | 1.40712 | 1.41236 | 1.40672 | ||
| 48 | 2009.08.18 03:50 | s/l | 24 | 1.70 | 1.41236 | 1.41236 | 1.40672 | -893.69 | 3149.72 |
| 49 | 2009.08.18 03:50 | sell | 25 | 1.30 | 1.41259 | 1.41783 | 1.41219 | ||
| 50 | 2009.08.18 03:57 | t/p | 25 | 1.30 | 1.41219 | 1.41783 | 1.41219 | 52.00 | 3201.72 |
| 51 | 2009.08.18 03:57 | sell | 26 | 1.30 | 1.41157 | 1.41681 | 1.41117 | ||
| 52 | 2009.08.18 05:10 | t/p | 26 | 1.30 | 1.41117 | 1.41681 | 1.41117 | 52.00 | 3253.72 |
| 53 | 2009.08.18 05:10 | sell | 27 | 1.40 | 1.41082 | 1.41606 | 1.41042 | ||
| 54 | 2009.08.18 05:20 | t/p | 27 | 1.40 | 1.41042 | 1.41606 | 1.41042 | 56.00 | 3309.72 |
| 55 | 2009.08.18 05:20 | sell | 28 | 1.40 | 1.40969 | 1.41493 | 1.40929 | ||
| 56 | 2009.08.18 11:02 | s/l | 28 | 1.40 | 1.41493 | 1.41493 | 1.40929 | -733.60 | 2576.12 |
| 57 | 2009.08.18 16:00 | sell | 29 | 1.10 | 1.40814 | 1.41338 | 1.40774 | ||
| 58 | 2009.08.18 17:45 | s/l | 29 | 1.10 | 1.41338 | 1.41338 | 1.40774 | -576.40 | 1999.72 |