Strategy Tester Report
AlpariUK-Demo (Build 225)
| Symbol | EURUSD (Euro vs US Dollar) | ||||
| Period | 1 Hour (H1) 2009.08.03 01:00 - 2009.10.01 00:00 (2009.08.01 - 2009.10.01) | ||||
| Model | Control points (a very crude method, the results must not be considered) | ||||
| Parameters | Lots=1; MAPeriod=6; RSIPeriod=10; ATRPeriod=28; ism=1.6; tpm=1; RSIUpperLevel=60; RSIUpperLimit=80; RSILowerLevel=39; RSILowerLimit=25; FastMAPeriod=5; SlowMAPeriod=24; SignalMAPeriod=14; MacdDiffBuy=0.5; MacdDiffSell=0.15; slippage=5; magicEA=11911; | ||||
| Bars in test | 1124 | Ticks modelled | 25909 | Modelling quality | n/a |
| Mismatched charts errors | 7 | ||||
| Initial deposit | 10000.00 | ||||
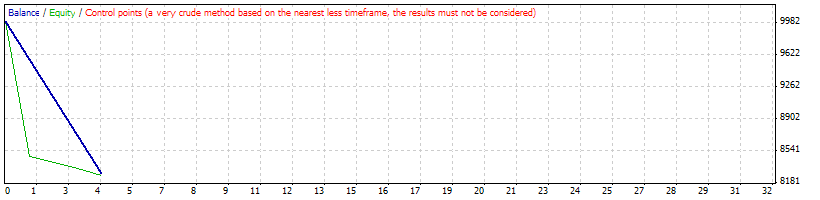
| Total net profit | -1708.00 | Gross profit | 0.00 | Gross loss | -1708.00 |
| Profit factor | 0.00 | Expected payoff | -427.00 | ||
| Absolute drawdown | 1708.00 | Maximal drawdown | 1864.00 (18.35%) | Relative drawdown | 18.35% (1864.00) |
| Total trades | 4 | Short positions (won %) | 4 (0.00%) | Long positions (won %) | 0 (0.00%) |
| Profit trades (% of total) | 0 (0.00%) | Loss trades (% of total) | 4 (100.00%) | ||
| Largest | profit trade | 0.00 | loss trade | -427.00 | |
| Average | profit trade | 0.00 | loss trade | -427.00 | |
| Maximum | consecutive wins (profit in money) | 0 (0.00) | consecutive losses (loss in money) | 4 (-1708.00) | |
| Maximal | consecutive profit (count of wins) | 0.00 (0) | consecutive loss (count of losses) | -1708.00 (4) | |
| Average | consecutive wins | 0 | consecutive losses | 4 | |
| # | Time | Type | Order | Size | Price | S / L | T / P | Profit | Balance |
| 1 | 2009.09.24 00:00 | sell | 1 | 1.00 | 1.46921 | 1.47348 | 1.46654 | ||
| 2 | 2009.09.24 00:00 | sell | 2 | 1.00 | 1.46921 | 1.47348 | 1.46521 | ||
| 3 | 2009.09.24 00:00 | sell | 3 | 1.00 | 1.46921 | 1.47348 | 1.46387 | ||
| 4 | 2009.09.24 00:00 | sell | 4 | 1.00 | 1.46921 | 1.47348 | 1.46254 | ||
| 5 | 2009.09.24 02:10 | s/l | 1 | 1.00 | 1.47348 | 1.47348 | 1.46654 | -427.00 | 9573.00 |
| 6 | 2009.09.24 02:10 | s/l | 2 | 1.00 | 1.47348 | 1.47348 | 1.46521 | -427.00 | 9146.00 |
| 7 | 2009.09.24 02:10 | s/l | 3 | 1.00 | 1.47348 | 1.47348 | 1.46387 | -427.00 | 8719.00 |
| 8 | 2009.09.24 02:10 | s/l | 4 | 1.00 | 1.47348 | 1.47348 | 1.46254 | -427.00 | 8292.00 |