Strategy Tester Report
AlpariUK-Demo (Build 225)
| Symbol | EURUSD (Euro vs US Dollar) | ||||
| Period | 1 Hour (H1) 2009.08.03 01:00 - 2009.10.01 00:00 (2009.08.01 - 2009.10.01) | ||||
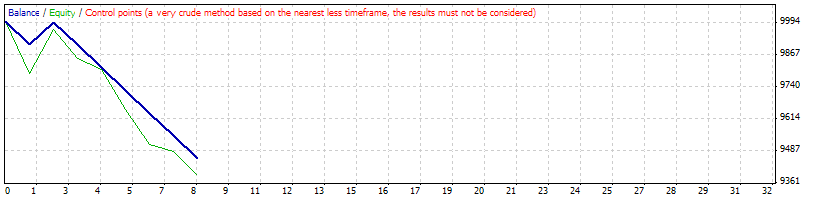
| Model | Control points (a very crude method, the results must not be considered) | ||||
| Parameters | FasterEMA=5; SlowerEMA=12; RSIPeriod=21; TotalLots=3; TPLevel1=55; TPLevel1Lots=1; TPLevel2=89; TPLevel2Lots=1; TPLevel3=144; | ||||
| Bars in test | 1124 | Ticks modelled | 25909 | Modelling quality | n/a |
| Mismatched charts errors | 7 | ||||
| Initial deposit | 10000.00 | ||||
| Total net profit | -543.00 | Gross profit | 87.00 | Gross loss | -630.00 |
| Profit factor | 0.14 | Expected payoff | -67.88 | ||
| Absolute drawdown | 543.00 | Maximal drawdown | 1221.00 (11.43%) | Relative drawdown | 11.43% (1221.00) |
| Total trades | 8 | Short positions (won %) | 5 (20.00%) | Long positions (won %) | 3 (0.00%) |
| Profit trades (% of total) | 1 (12.50%) | Loss trades (% of total) | 7 (87.50%) | ||
| Largest | profit trade | 87.00 | loss trade | -90.00 | |
| Average | profit trade | 87.00 | loss trade | -90.00 | |
| Maximum | consecutive wins (profit in money) | 1 (87.00) | consecutive losses (loss in money) | 6 (-540.00) | |
| Maximal | consecutive profit (count of wins) | 87.00 (1) | consecutive loss (count of losses) | -540.00 (6) | |
| Average | consecutive wins | 1 | consecutive losses | 4 | |
| # | Time | Type | Order | Size | Price | S / L | T / P | Profit | Balance |
| 1 | 2009.08.12 13:00 | buy | 1 | 3.00 | 1.41637 | 1.41607 | 0.00000 | ||
| 2 | 2009.08.12 13:20 | s/l | 1 | 3.00 | 1.41607 | 1.41607 | 0.00000 | -90.00 | 9910.00 |
| 3 | 2009.08.14 16:00 | sell | 2 | 3.00 | 1.42474 | 1.42504 | 0.00000 | ||
| 4 | 2009.08.14 17:00 | modify | 2 | 3.00 | 1.42474 | 1.42445 | 0.00000 | ||
| 5 | 2009.08.14 17:03 | s/l | 2 | 3.00 | 1.42445 | 1.42445 | 0.00000 | 87.00 | 9997.00 |
| 6 | 2009.08.18 18:00 | buy | 3 | 3.00 | 1.41275 | 1.41245 | 0.00000 | ||
| 7 | 2009.08.18 18:20 | s/l | 3 | 3.00 | 1.41245 | 1.41245 | 0.00000 | -90.00 | 9907.00 |
| 8 | 2009.08.24 20:00 | sell | 4 | 3.00 | 1.42996 | 1.43026 | 0.00000 | ||
| 9 | 2009.08.24 21:32 | s/l | 4 | 3.00 | 1.43026 | 1.43026 | 0.00000 | -90.00 | 9817.00 |
| 10 | 2009.08.27 12:00 | buy | 5 | 3.00 | 1.42662 | 1.42632 | 0.00000 | ||
| 11 | 2009.08.27 12:20 | s/l | 5 | 3.00 | 1.42632 | 1.42632 | 0.00000 | -90.00 | 9727.00 |
| 12 | 2009.09.01 13:00 | sell | 6 | 3.00 | 1.42873 | 1.42903 | 0.00000 | ||
| 13 | 2009.09.01 13:10 | s/l | 6 | 3.00 | 1.42903 | 1.42903 | 0.00000 | -90.00 | 9637.00 |
| 14 | 2009.09.11 19:00 | sell | 7 | 3.00 | 1.45742 | 1.45772 | 0.00000 | ||
| 15 | 2009.09.11 19:15 | s/l | 7 | 3.00 | 1.45772 | 1.45772 | 0.00000 | -90.00 | 9547.00 |
| 16 | 2009.09.18 18:00 | sell | 8 | 3.00 | 1.47021 | 1.47051 | 0.00000 | ||
| 17 | 2009.09.18 18:02 | s/l | 8 | 3.00 | 1.47051 | 1.47051 | 0.00000 | -90.00 | 9457.00 |