Strategy Tester Report
AlpariUK-Demo (Build 225)
| Symbol | EURUSD (Euro vs US Dollar) | ||||
| Period | 1 Hour (H1) 2009.08.03 01:00 - 2009.10.01 00:00 (2009.08.01 - 2009.10.01) | ||||
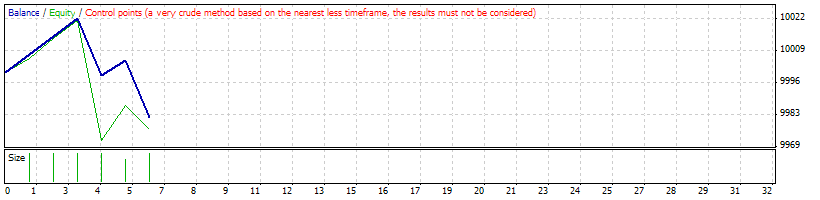
| Model | Control points (a very crude method, the results must not be considered) | ||||
| Parameters | LotPercentage=5; MinVal=5000; StopLossVal=47; TimePeriod=30; UseTS=0; TrailingStopLevel=75; BrokerMinLotSize=0.1; FixedLots=0; MyLotSize=1; LotValue=0; MarginVal=100; LimitHours=1; StartHours=21; StartMins=0; EndHours=7; EndMins=0; | ||||
| Bars in test | 1124 | Ticks modelled | 25909 | Modelling quality | n/a |
| Mismatched charts errors | 7 | ||||
| Initial deposit | 10000.00 | ||||
| Total net profit | -18.50 | Gross profit | 28.50 | Gross loss | -47.00 |
| Profit factor | 0.61 | Expected payoff | -3.08 | ||
| Absolute drawdown | 18.50 | Maximal drawdown | 264.70 (2.58%) | Relative drawdown | 2.58% (264.70) |
| Total trades | 6 | Short positions (won %) | 0 (0.00%) | Long positions (won %) | 6 (66.67%) |
| Profit trades (% of total) | 4 (66.67%) | Loss trades (% of total) | 2 (33.33%) | ||
| Largest | profit trade | 7.50 | loss trade | -23.50 | |
| Average | profit trade | 7.13 | loss trade | -23.50 | |
| Maximum | consecutive wins (profit in money) | 3 (22.50) | consecutive losses (loss in money) | 1 (-23.50) | |
| Maximal | consecutive profit (count of wins) | 22.50 (3) | consecutive loss (count of losses) | -23.50 (1) | |
| Average | consecutive wins | 2 | consecutive losses | 1 | |
| # | Time | Type | Order | Size | Price | S / L | T / P | Profit | Balance |
| 1 | 2009.08.04 16:55 | buy | 1 | 0.50 | 1.43916 | 1.43869 | 0.00000 | ||
| 2 | 2009.08.04 16:57 | modify | 1 | 0.50 | 1.43916 | 1.43931 | 1.44616 | ||
| 3 | 2009.08.04 18:07 | s/l | 1 | 0.50 | 1.43931 | 1.43931 | 1.44616 | 7.50 | 10007.50 |
| 4 | 2009.09.18 15:50 | buy | 2 | 0.50 | 1.47054 | 1.47007 | 0.00000 | ||
| 5 | 2009.09.18 15:57 | modify | 2 | 0.50 | 1.47054 | 1.47069 | 1.47754 | ||
| 6 | 2009.09.18 16:05 | s/l | 2 | 0.50 | 1.47069 | 1.47069 | 1.47754 | 7.50 | 10015.00 |
| 7 | 2009.09.21 19:20 | buy | 3 | 0.50 | 1.46714 | 1.46667 | 0.00000 | ||
| 8 | 2009.09.21 19:40 | modify | 3 | 0.50 | 1.46714 | 1.46729 | 1.47414 | ||
| 9 | 2009.09.21 20:07 | s/l | 3 | 0.50 | 1.46729 | 1.46729 | 1.47414 | 7.50 | 10022.50 |
| 10 | 2009.09.24 10:10 | buy | 4 | 0.50 | 1.47468 | 1.47421 | 0.00000 | ||
| 11 | 2009.09.24 10:16 | s/l | 4 | 0.50 | 1.47421 | 1.47421 | 0.00000 | -23.50 | 9999.00 |
| 12 | 2009.09.24 10:23 | buy | 5 | 0.40 | 1.47397 | 1.47350 | 0.00000 | ||
| 13 | 2009.09.24 10:26 | modify | 5 | 0.40 | 1.47397 | 1.47412 | 1.48097 | ||
| 14 | 2009.09.24 16:03 | s/l | 5 | 0.40 | 1.47412 | 1.47412 | 1.48097 | 6.00 | 10005.00 |
| 15 | 2009.09.25 17:59 | buy | 6 | 0.50 | 1.46826 | 1.46779 | 0.00000 | ||
| 16 | 2009.09.25 18:10 | s/l | 6 | 0.50 | 1.46779 | 1.46779 | 0.00000 | -23.50 | 9981.50 |