Strategy Tester Report
AlpariUK-Demo (Build 225)
| Symbol | EURUSD (Euro vs US Dollar) | ||||
| Period | 1 Hour (H1) 2009.08.03 01:00 - 2009.10.01 00:00 (2009.08.01 - 2009.10.01) | ||||
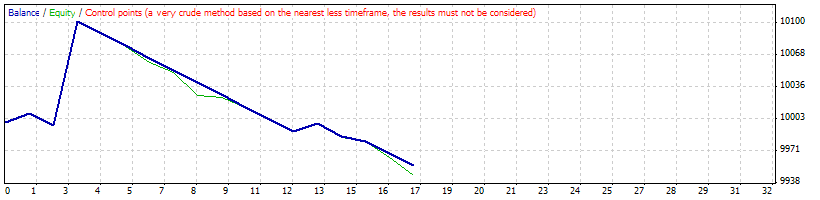
| Model | Control points (a very crude method, the results must not be considered) | ||||
| Parameters | Lots=0.1; Risk=0.1; Sl=100; Tp=0; bu=0; magic=78977; PriseShift=10; AutoLot=false; CloseEndDay=true; BU=false; MaPeriod=22; MaShift=1; Fast=12; Slow=26; Signal=9; MacdShift=1; | ||||
| Bars in test | 1124 | Ticks modelled | 25909 | Modelling quality | n/a |
| Mismatched charts errors | 7 | ||||
| Initial deposit | 10000.00 | ||||
| Total net profit | -44.00 | Gross profit | 122.30 | Gross loss | -166.30 |
| Profit factor | 0.74 | Expected payoff | -2.59 | ||
| Absolute drawdown | 44.00 | Maximal drawdown | 182.20 (1.80%) | Relative drawdown | 1.80% (182.20) |
| Total trades | 17 | Short positions (won %) | 8 (25.00%) | Long positions (won %) | 9 (11.11%) |
| Profit trades (% of total) | 3 (17.65%) | Loss trades (% of total) | 14 (82.35%) | ||
| Largest | profit trade | 105.70 | loss trade | -12.40 | |
| Average | profit trade | 40.77 | loss trade | -11.88 | |
| Maximum | consecutive wins (profit in money) | 1 (105.70) | consecutive losses (loss in money) | 9 (-111.60) | |
| Maximal | consecutive profit (count of wins) | 105.70 (1) | consecutive loss (count of losses) | -111.60 (9) | |
| Average | consecutive wins | 1 | consecutive losses | 5 | |
| # | Time | Type | Order | Size | Price | S / L | T / P | Profit | Balance |
| 1 | 2009.08.06 18:00 | sell | 1 | 0.10 | 1.43568 | 1.43692 | 0.00000 | ||
| 2 | 2009.08.06 23:00 | close | 1 | 0.10 | 1.43480 | 1.43692 | 0.00000 | 8.80 | 10008.80 |
| 3 | 2009.08.12 21:00 | buy | 2 | 0.10 | 1.42121 | 1.41997 | 0.00000 | ||
| 4 | 2009.08.12 21:02 | s/l | 2 | 0.10 | 1.41997 | 1.41997 | 0.00000 | -12.40 | 9996.40 |
| 5 | 2009.08.17 00:00 | sell | 3 | 0.10 | 1.41890 | 1.42014 | 0.00000 | ||
| 6 | 2009.08.17 23:00 | close | 3 | 0.10 | 1.40833 | 1.42014 | 0.00000 | 105.70 | 10102.10 |
| 7 | 2009.08.19 02:00 | buy | 4 | 0.10 | 1.41683 | 1.41559 | 0.00000 | ||
| 8 | 2009.08.19 02:15 | s/l | 4 | 0.10 | 1.41559 | 1.41559 | 0.00000 | -12.40 | 10089.70 |
| 9 | 2009.08.25 03:00 | sell | 5 | 0.10 | 1.42819 | 1.42943 | 0.00000 | ||
| 10 | 2009.08.25 04:02 | s/l | 5 | 0.10 | 1.42943 | 1.42943 | 0.00000 | -12.40 | 10077.30 |
| 11 | 2009.08.26 07:00 | sell | 6 | 0.10 | 1.42950 | 1.43074 | 0.00000 | ||
| 12 | 2009.08.26 07:40 | s/l | 6 | 0.10 | 1.43074 | 1.43074 | 0.00000 | -12.40 | 10064.90 |
| 13 | 2009.08.28 02:00 | buy | 7 | 0.10 | 1.43715 | 1.43591 | 0.00000 | ||
| 14 | 2009.08.28 02:20 | s/l | 7 | 0.10 | 1.43591 | 1.43591 | 0.00000 | -12.40 | 10052.50 |
| 15 | 2009.08.31 05:00 | sell | 8 | 0.10 | 1.42913 | 1.43037 | 0.00000 | ||
| 16 | 2009.08.31 16:13 | s/l | 8 | 0.10 | 1.43037 | 1.43037 | 0.00000 | -12.40 | 10040.10 |
| 17 | 2009.09.01 00:00 | buy | 9 | 0.10 | 1.43327 | 1.43203 | 0.00000 | ||
| 18 | 2009.09.01 12:15 | s/l | 9 | 0.10 | 1.43203 | 1.43203 | 0.00000 | -12.40 | 10027.70 |
| 19 | 2009.09.01 20:00 | sell | 10 | 0.10 | 1.42097 | 1.42221 | 0.00000 | ||
| 20 | 2009.09.01 21:20 | s/l | 10 | 0.10 | 1.42221 | 1.42221 | 0.00000 | -12.40 | 10015.30 |
| 21 | 2009.09.03 02:00 | buy | 11 | 0.10 | 1.42746 | 1.42622 | 0.00000 | ||
| 22 | 2009.09.03 02:45 | s/l | 11 | 0.10 | 1.42622 | 1.42622 | 0.00000 | -12.40 | 10002.90 |
| 23 | 2009.09.04 03:00 | sell | 12 | 0.10 | 1.42511 | 1.42635 | 0.00000 | ||
| 24 | 2009.09.04 06:50 | s/l | 12 | 0.10 | 1.42635 | 1.42635 | 0.00000 | -12.40 | 9990.50 |
| 25 | 2009.09.07 02:00 | buy | 13 | 0.10 | 1.43234 | 1.43110 | 0.00000 | ||
| 26 | 2009.09.07 23:00 | close | 13 | 0.10 | 1.43312 | 1.43110 | 0.00000 | 7.80 | 9998.30 |
| 27 | 2009.09.14 07:00 | sell | 14 | 0.10 | 1.45457 | 1.45581 | 0.00000 | ||
| 28 | 2009.09.14 09:40 | s/l | 14 | 0.10 | 1.45581 | 1.45581 | 0.00000 | -12.40 | 9985.90 |
| 29 | 2009.09.14 22:00 | buy | 15 | 0.10 | 1.46221 | 1.46097 | 0.00000 | ||
| 30 | 2009.09.14 23:00 | close | 15 | 0.10 | 1.46170 | 1.46097 | 0.00000 | -5.10 | 9980.80 |
| 31 | 2009.09.22 09:00 | buy | 16 | 0.10 | 1.47412 | 1.47288 | 0.00000 | ||
| 32 | 2009.09.22 09:07 | s/l | 16 | 0.10 | 1.47288 | 1.47288 | 0.00000 | -12.40 | 9968.40 |
| 33 | 2009.09.30 10:00 | buy | 17 | 0.10 | 1.46061 | 1.45937 | 0.00000 | ||
| 34 | 2009.09.30 14:50 | s/l | 17 | 0.10 | 1.45937 | 1.45937 | 0.00000 | -12.40 | 9956.00 |