Strategy Tester Report
AlpariUK-Demo (Build 225)
| Symbol | EURUSD (Euro vs US Dollar) | ||||
| Period | 1 Hour (H1) 2009.08.03 01:00 - 2009.10.01 00:00 (2009.08.01 - 2009.10.01) | ||||
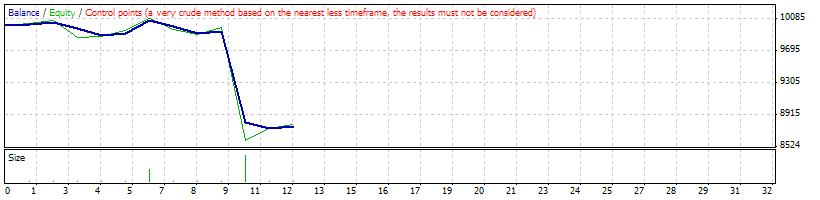
| Model | Control points (a very crude method, the results must not be considered) | ||||
| Parameters | p=10; tp=50; sl=50; lots=1; losseslimit=1000000; fastoptimize=false; mn=888; | ||||
| Bars in test | 1124 | Ticks modelled | 25909 | Modelling quality | n/a |
| Mismatched charts errors | 7 | ||||
| Initial deposit | 10000.00 | ||||
| Total net profit | -1230.06 | Gross profit | 265.98 | Gross loss | -1496.04 |
| Profit factor | 0.18 | Expected payoff | -102.51 | ||
| Absolute drawdown | 1252.06 | Maximal drawdown | 1318.04 (13.09%) | Relative drawdown | 13.09% (1318.04) |
| Total trades | 12 | Short positions (won %) | 1 (0.00%) | Long positions (won %) | 11 (54.55%) |
| Profit trades (% of total) | 6 (50.00%) | Loss trades (% of total) | 6 (50.00%) | ||
| Largest | profit trade | 155.98 | loss trade | -1106.04 | |
| Average | profit trade | 44.33 | loss trade | -249.34 | |
| Maximum | consecutive wins (profit in money) | 2 (177.98) | consecutive losses (loss in money) | 2 (-1184.04) | |
| Maximal | consecutive profit (count of wins) | 177.98 (2) | consecutive loss (count of losses) | -1184.04 (2) | |
| Average | consecutive wins | 2 | consecutive losses | 2 | |
| # | Time | Type | Order | Size | Price | S / L | T / P | Profit | Balance |
| 1 | 2009.08.03 01:00 | buy | 1 | 1.00 | 1.42533 | 1.42455 | 1.42555 | ||
| 2 | 2009.08.03 01:05 | t/p | 1 | 1.00 | 1.42555 | 1.42455 | 1.42555 | 22.00 | 10022.00 |
| 3 | 2009.08.03 02:00 | buy | 2 | 1.00 | 1.42891 | 1.42813 | 1.42913 | ||
| 4 | 2009.08.03 02:07 | t/p | 2 | 1.00 | 1.42913 | 1.42813 | 1.42913 | 22.00 | 10044.00 |
| 5 | 2009.08.03 03:00 | buy | 3 | 1.00 | 1.42546 | 1.42468 | 1.42568 | ||
| 6 | 2009.08.03 03:02 | s/l | 3 | 1.00 | 1.42468 | 1.42468 | 1.42568 | -78.00 | 9966.00 |
| 7 | 2009.08.03 04:00 | buy | 4 | 1.00 | 1.42438 | 1.42360 | 1.42460 | ||
| 8 | 2009.08.03 04:15 | s/l | 4 | 1.00 | 1.42360 | 1.42360 | 1.42460 | -78.00 | 9888.00 |
| 9 | 2009.08.03 05:00 | buy | 5 | 1.00 | 1.42516 | 1.42438 | 1.42538 | ||
| 10 | 2009.08.03 05:02 | t/p | 5 | 1.00 | 1.42538 | 1.42438 | 1.42538 | 22.00 | 9910.00 |
| 11 | 2009.08.03 06:00 | buy | 6 | 7.09 | 1.42367 | 1.42289 | 1.42389 | ||
| 12 | 2009.08.03 06:03 | t/p | 6 | 7.09 | 1.42389 | 1.42289 | 1.42389 | 155.98 | 10065.98 |
| 13 | 2009.08.03 07:00 | buy | 7 | 1.00 | 1.42486 | 1.42408 | 1.42508 | ||
| 14 | 2009.08.03 07:20 | s/l | 7 | 1.00 | 1.42408 | 1.42408 | 1.42508 | -78.00 | 9987.98 |
| 15 | 2009.08.03 08:00 | buy | 8 | 1.00 | 1.42376 | 1.42298 | 1.42398 | ||
| 16 | 2009.08.03 08:02 | s/l | 8 | 1.00 | 1.42298 | 1.42298 | 1.42398 | -78.00 | 9909.98 |
| 17 | 2009.08.03 09:00 | buy | 9 | 1.00 | 1.42114 | 1.42036 | 1.42136 | ||
| 18 | 2009.08.03 09:10 | t/p | 9 | 1.00 | 1.42136 | 1.42036 | 1.42136 | 22.00 | 9931.98 |
| 19 | 2009.08.03 10:00 | sell | 10 | 14.18 | 1.42273 | 1.42351 | 1.42251 | ||
| 20 | 2009.08.03 10:10 | s/l | 10 | 14.18 | 1.42351 | 1.42351 | 1.42251 | -1106.04 | 8825.94 |
| 21 | 2009.08.03 11:00 | buy | 11 | 1.00 | 1.42768 | 1.42690 | 1.42790 | ||
| 22 | 2009.08.03 11:02 | s/l | 11 | 1.00 | 1.42690 | 1.42690 | 1.42790 | -78.00 | 8747.94 |
| 23 | 2009.08.03 12:00 | buy | 12 | 1.00 | 1.42806 | 1.42728 | 1.42828 | ||
| 24 | 2009.08.03 12:03 | t/p | 12 | 1.00 | 1.42828 | 1.42728 | 1.42828 | 22.00 | 8769.94 |