Strategy Tester Report
AlpariUK-Demo (Build 225)
| Symbol | EURUSD (Euro vs US Dollar) | ||||
| Period | 1 Hour (H1) 2009.08.03 01:00 - 2009.10.01 00:00 (2009.08.01 - 2009.10.01) | ||||
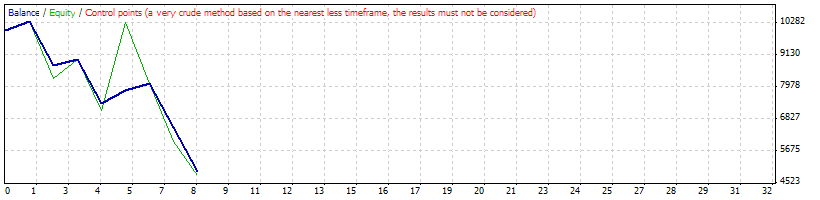
| Model | Control points (a very crude method, the results must not be considered) | ||||
| Parameters | TakeProfit=4; Lots=20; StopLoss=80; TimeOpen=2; p1=13; p2=14; | ||||
| Bars in test | 1124 | Ticks modelled | 25909 | Modelling quality | n/a |
| Mismatched charts errors | 7 | ||||
| Initial deposit | 10000.00 | ||||
| Total net profit | -5080.00 | Gross profit | 1320.00 | Gross loss | -6400.00 |
| Profit factor | 0.21 | Expected payoff | -635.00 | ||
| Absolute drawdown | 5080.00 | Maximal drawdown | 5420.00 (52.42%) | Relative drawdown | 52.42% (5420.00) |
| Total trades | 8 | Short positions (won %) | 8 (50.00%) | Long positions (won %) | 0 (0.00%) |
| Profit trades (% of total) | 4 (50.00%) | Loss trades (% of total) | 4 (50.00%) | ||
| Largest | profit trade | 460.00 | loss trade | -1600.00 | |
| Average | profit trade | 330.00 | loss trade | -1600.00 | |
| Maximum | consecutive wins (profit in money) | 2 (740.00) | consecutive losses (loss in money) | 2 (-3200.00) | |
| Maximal | consecutive profit (count of wins) | 740.00 (2) | consecutive loss (count of losses) | -3200.00 (2) | |
| Average | consecutive wins | 1 | consecutive losses | 1 | |
| # | Time | Type | Order | Size | Price | S / L | T / P | Profit | Balance |
| 1 | 2009.08.03 03:59 | sell | 1 | 20.00 | 1.42409 | 1.42489 | 1.42386 | ||
| 2 | 2009.08.03 04:10 | close | 1 | 20.00 | 1.42392 | 1.42489 | 1.42386 | 340.00 | 10340.00 |
| 3 | 2009.08.03 04:59 | sell | 2 | 20.00 | 1.42486 | 1.42566 | 1.42463 | ||
| 4 | 2009.08.03 05:02 | s/l | 2 | 20.00 | 1.42566 | 1.42566 | 1.42463 | -1600.00 | 8740.00 |
| 5 | 2009.08.03 08:59 | sell | 3 | 20.00 | 1.42083 | 1.42163 | 1.42060 | ||
| 6 | 2009.08.03 09:07 | close | 3 | 20.00 | 1.42071 | 1.42163 | 1.42060 | 240.00 | 8980.00 |
| 7 | 2009.08.03 11:59 | sell | 4 | 20.00 | 1.42777 | 1.42857 | 1.42754 | ||
| 8 | 2009.08.03 12:03 | s/l | 4 | 20.00 | 1.42857 | 1.42857 | 1.42754 | -1600.00 | 7380.00 |
| 9 | 2009.08.03 13:59 | sell | 5 | 20.00 | 1.43179 | 1.43259 | 1.43156 | ||
| 10 | 2009.08.03 14:02 | t/p | 5 | 20.00 | 1.43156 | 1.43259 | 1.43156 | 460.00 | 7840.00 |
| 11 | 2009.08.03 14:59 | sell | 6 | 20.00 | 1.43141 | 1.43221 | 1.43118 | ||
| 12 | 2009.08.03 15:07 | close | 6 | 20.00 | 1.43127 | 1.43221 | 1.43118 | 280.00 | 8120.00 |
| 13 | 2009.08.03 16:59 | sell | 7 | 20.00 | 1.44165 | 1.44245 | 1.44142 | ||
| 14 | 2009.08.03 17:02 | s/l | 7 | 20.00 | 1.44245 | 1.44245 | 1.44142 | -1600.00 | 6520.00 |
| 15 | 2009.08.03 18:59 | sell | 8 | 20.00 | 1.44027 | 1.44107 | 1.44004 | ||
| 16 | 2009.08.03 19:20 | s/l | 8 | 20.00 | 1.44107 | 1.44107 | 1.44004 | -1600.00 | 4920.00 |