Strategy Tester Report
AlpariUK-Demo (Build 225)
| Symbol | EURUSD (Euro vs US Dollar) | ||||
| Period | 1 Hour (H1) 2009.08.03 01:00 - 2009.10.01 00:00 (2009.08.01 - 2009.10.01) | ||||
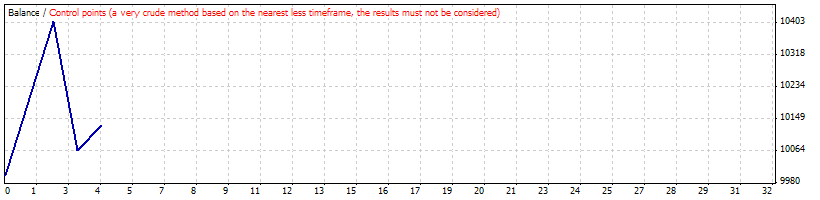
| Model | Control points (a very crude method, the results must not be considered) | ||||
| Parameters | MagicNumber=0; EachTickMode=false; Lots=0.1; Slippage=3; StopLossMode=false; StopLoss=30; TakeProfitMode=false; TakeProfit=60; TrailingStopMode=false; TrailingStop=30; | ||||
| Bars in test | 1124 | Ticks modelled | 25909 | Modelling quality | n/a |
| Mismatched charts errors | 7 | ||||
| Initial deposit | 10000.00 | ||||
| Total net profit | 131.50 | Gross profit | 472.50 | Gross loss | -341.00 |
| Profit factor | 1.39 | Expected payoff | 32.88 | ||
| Absolute drawdown | 147.85 | Maximal drawdown | 668.00 (6.35%) | Relative drawdown | 6.35% (668.00) |
| Total trades | 4 | Short positions (won %) | 2 (50.00%) | Long positions (won %) | 2 (100.00%) |
| Profit trades (% of total) | 3 (75.00%) | Loss trades (% of total) | 1 (25.00%) | ||
| Largest | profit trade | 204.00 | loss trade | -341.00 | |
| Average | profit trade | 157.50 | loss trade | -341.00 | |
| Maximum | consecutive wins (profit in money) | 2 (407.45) | consecutive losses (loss in money) | 1 (-341.00) | |
| Maximal | consecutive profit (count of wins) | 407.45 (2) | consecutive loss (count of losses) | -341.00 (1) | |
| Average | consecutive wins | 2 | consecutive losses | 1 | |
| # | Time | Type | Order | Size | Price | S / L | T / P | Profit | Balance |
| 1 | 2009.08.05 08:00 | sell | 1 | 0.10 | 1.43833 | 0.00000 | 0.00000 | ||
| 2 | 2009.08.11 11:00 | close | 1 | 0.10 | 1.41787 | 0.00000 | 0.00000 | 204.00 | 10204.00 |
| 3 | 2009.08.17 20:00 | buy | 2 | 0.10 | 1.40911 | 0.00000 | 0.00000 | ||
| 4 | 2009.08.24 09:00 | close | 2 | 0.10 | 1.42949 | 0.00000 | 0.00000 | 203.45 | 10407.45 |
| 5 | 2009.08.24 22:00 | sell | 3 | 0.10 | 1.42933 | 0.00000 | 0.00000 | ||
| 6 | 2009.09.29 01:00 | close | 3 | 0.10 | 1.46307 | 0.00000 | 0.00000 | -341.00 | 10066.45 |
| 7 | 2009.09.29 21:00 | buy | 4 | 0.10 | 1.45714 | 0.00000 | 0.00000 | ||
| 8 | 2009.09.30 23:59 | close at stop | 4 | 0.10 | 1.46365 | 0.00000 | 0.00000 | 65.05 | 10131.50 |