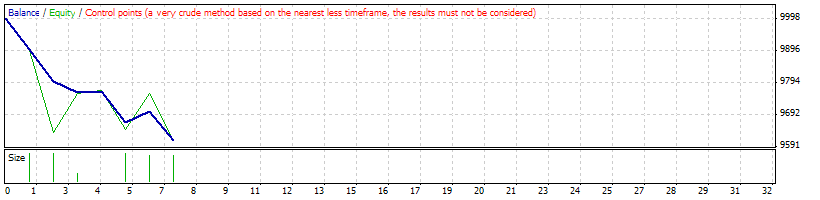
Strategy Tester Report
up3x1_Investor_v1
AlpariUK-Demo (Build 225)
| Symbol | EURUSD (Euro vs US Dollar) | ||||
| Period | 1 Hour (H1) 2009.08.03 01:00 - 2009.10.01 00:00 (2009.08.01 - 2009.10.01) | ||||
| Model | Control points (a very crude method, the results must not be considered) | ||||
| Parameters | Lots=0.1; MaximumRisk=0.2; DecreaseFactor=3; TakeProfit=20; StopLoss=50; TrailingStop=10; | ||||
| Bars in test | 1124 | Ticks modelled | 25909 | Modelling quality | n/a |
| Mismatched charts errors | 3 | ||||
| Initial deposit | 10000.00 | ||||
| Total net profit | -390.00 | Gross profit | 40.00 | Gross loss | -430.00 |
| Profit factor | 0.09 | Expected payoff | -55.71 | ||
| Absolute drawdown | 390.00 | Maximal drawdown | 390.00 (3.90%) | Relative drawdown | 3.90% (390.00) |
| Total trades | 7 | Short positions (won %) | 7 (28.57%) | Long positions (won %) | 0 (0.00%) |
| Profit trades (% of total) | 2 (28.57%) | Loss trades (% of total) | 5 (71.43%) | ||
| Largest | profit trade | 38.00 | loss trade | -100.00 | |
| Average | profit trade | 20.00 | loss trade | -86.00 | |
| Maximum | consecutive wins (profit in money) | 1 (38.00) | consecutive losses (loss in money) | 3 (-235.00) | |
| Maximal | consecutive profit (count of wins) | 38.00 (1) | consecutive loss (count of losses) | -235.00 (3) | |
| Average | consecutive wins | 1 | consecutive losses | 2 | |
| # | Time | Type | Order | Size | Price | S / L | T / P | Profit | Balance |
| 1 | 2009.08.07 17:00 | sell | 1 | 2.00 | 1.42067 | 1.42117 | 1.42047 | ||
| 2 | 2009.08.07 17:05 | s/l | 1 | 2.00 | 1.42117 | 1.42117 | 1.42047 | -100.00 | 9900.00 |
| 3 | 2009.08.26 16:00 | sell | 2 | 2.00 | 1.42146 | 1.42196 | 1.42126 | ||
| 4 | 2009.08.26 16:03 | s/l | 2 | 2.00 | 1.42196 | 1.42196 | 1.42126 | -100.00 | 9800.00 |
| 5 | 2009.08.28 21:00 | sell | 3 | 0.70 | 1.42862 | 1.42912 | 1.42842 | ||
| 6 | 2009.08.28 21:10 | s/l | 3 | 0.70 | 1.42912 | 1.42912 | 1.42842 | -35.00 | 9765.00 |
| 7 | 2009.09.01 18:00 | sell | 4 | 0.10 | 1.42338 | 1.42388 | 1.42318 | ||
| 8 | 2009.09.01 18:10 | t/p | 4 | 0.10 | 1.42318 | 1.42388 | 1.42318 | 2.00 | 9767.00 |
| 9 | 2009.09.23 22:00 | sell | 5 | 2.00 | 1.47418 | 1.47468 | 1.47398 | ||
| 10 | 2009.09.23 22:07 | s/l | 5 | 2.00 | 1.47468 | 1.47468 | 1.47398 | -100.00 | 9667.00 |
| 11 | 2009.09.24 17:00 | sell | 6 | 1.90 | 1.47068 | 1.47118 | 1.47048 | ||
| 12 | 2009.09.24 17:10 | t/p | 6 | 1.90 | 1.47048 | 1.47118 | 1.47048 | 38.00 | 9705.00 |
| 13 | 2009.09.29 10:00 | sell | 7 | 1.90 | 1.45775 | 1.45825 | 1.45755 | ||
| 14 | 2009.09.29 10:02 | s/l | 7 | 1.90 | 1.45825 | 1.45825 | 1.45755 | -95.00 | 9610.00 |