Strategy Tester Report
AlpariUK-Demo (Build 225)
| Symbol | EURUSD (Euro vs US Dollar) | ||||
| Period | 1 Hour (H1) 2009.08.03 01:00 - 2009.10.01 00:00 (2009.08.01 - 2009.10.01) | ||||
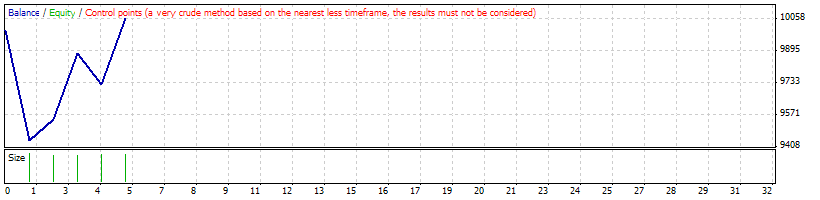
| Model | Control points (a very crude method, the results must not be considered) | ||||
| Parameters | LotSize=0.01; Slippage=3; StopLoss=0; TakeProfit=700; RiskPercent=1; UseMoneyMgmt=true; RSIsetting=12; RSI_TF=240; RSI_Overbought_Value=75; RSI_Oversold_Value=25; | ||||
| Bars in test | 1124 | Ticks modelled | 25909 | Modelling quality | n/a |
| Mismatched charts errors | 7 | ||||
| Initial deposit | 10000.00 | ||||
| Total net profit | 60.48 | Gross profit | 778.52 | Gross loss | -718.04 |
| Profit factor | 1.08 | Expected payoff | 12.10 | ||
| Absolute drawdown | 1612.75 | Maximal drawdown | 1726.50 (17.07%) | Relative drawdown | 17.07% (1726.50) |
| Total trades | 5 | Short positions (won %) | 2 (50.00%) | Long positions (won %) | 3 (66.67%) |
| Profit trades (% of total) | 3 (60.00%) | Loss trades (% of total) | 2 (40.00%) | ||
| Largest | profit trade | 337.12 | loss trade | -560.75 | |
| Average | profit trade | 259.51 | loss trade | -359.02 | |
| Maximum | consecutive wins (profit in money) | 2 (441.40) | consecutive losses (loss in money) | 1 (-560.75) | |
| Maximal | consecutive profit (count of wins) | 441.40 (2) | consecutive loss (count of losses) | -560.75 (1) | |
| Average | consecutive wins | 2 | consecutive losses | 1 | |
| # | Time | Type | Order | Size | Price | S / L | T / P | Profit | Balance |
| 1 | 2009.08.06 16:00 | buy | 1 | 0.50 | 1.43669 | 0.00000 | 1.44358 | ||
| 2 | 2009.08.19 20:00 | close | 1 | 0.50 | 1.42553 | 0.00000 | 1.44358 | -560.75 | 9439.25 |
| 3 | 2009.08.19 20:00 | sell | 2 | 0.47 | 1.42553 | 0.00000 | 1.41864 | ||
| 4 | 2009.08.20 16:00 | close | 2 | 0.47 | 1.42314 | 0.00000 | 1.41864 | 110.92 | 9550.17 |
| 5 | 2009.08.20 16:00 | buy | 3 | 0.48 | 1.42314 | 0.00000 | 1.43003 | ||
| 6 | 2009.08.21 06:00 | modify | 3 | 0.48 | 1.42314 | 1.41473 | 1.43003 | ||
| 7 | 2009.08.21 09:50 | t/p | 3 | 0.48 | 1.43003 | 1.41473 | 1.43003 | 330.48 | 9880.65 |
| 8 | 2009.09.02 12:00 | sell | 4 | 0.49 | 1.42262 | 0.00000 | 1.41573 | ||
| 9 | 2009.09.03 20:00 | close | 4 | 0.49 | 1.42580 | 0.00000 | 1.41573 | -157.29 | 9723.36 |
| 10 | 2009.09.03 20:00 | buy | 5 | 0.49 | 1.42580 | 0.00000 | 1.43269 | ||
| 11 | 2009.09.07 02:20 | t/p | 5 | 0.49 | 1.43269 | 0.00000 | 1.43269 | 337.12 | 10060.48 |