Strategy Tester Report
AlpariUK-Demo (Build 225)
| Symbol | GBPUSD (Great Britain Pound vs US Dollar) | ||||
| Period | 1 Hour (H1) 2010.01.04 00:00 - 2010.02.26 22:00 (2010.01.01 - 2010.02.27) | ||||
| Model | Control points (a very crude method, the results must not be considered) | ||||
| Parameters | Lots=0.1; ZZbar=1; Closebar=3; CloseBars=5; Maxord=10; Sl=0; Tp=0; bu=0; Rew=0; ClosePos=1; Drive=false; _Bu=false; Autolot=true; magic=78977; | ||||
| Bars in test | 1953 | Ticks modelled | 24825 | Modelling quality | n/a |
| Mismatched charts errors | 0 | ||||
| Initial deposit | 10000.00 | ||||
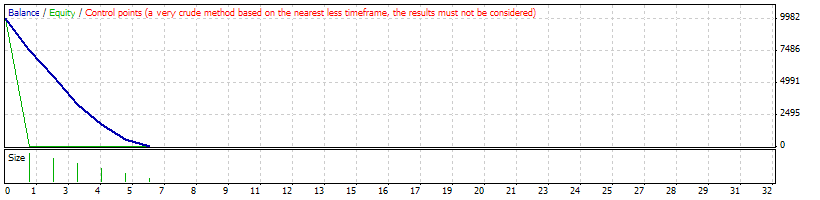
| Total net profit | -9955.82 | Gross profit | 0.00 | Gross loss | -9955.82 |
| Profit factor | 0.00 | Expected payoff | -1659.30 | ||
| Absolute drawdown | 9955.82 | Maximal drawdown | 13301.66 (99.67%) | Relative drawdown | 99.67% (13301.66) |
| Total trades | 6 | Short positions (won %) | 0 (0.00%) | Long positions (won %) | 6 (0.00%) |
| Profit trades (% of total) | 0 (0.00%) | Loss trades (% of total) | 6 (100.00%) | ||
| Largest | profit trade | 0.00 | loss trade | -2492.76 | |
| Average | profit trade | 0.00 | loss trade | -1659.30 | |
| Maximum | consecutive wins (profit in money) | 0 (0.00) | consecutive losses (loss in money) | 6 (-9955.82) | |
| Maximal | consecutive profit (count of wins) | 0.00 (0) | consecutive loss (count of losses) | -9955.82 (6) | |
| Average | consecutive wins | 0 | consecutive losses | 6 | |
| # | Time | Type | Order | Size | Price | S / L | T / P | Profit | Balance |
| 1 | 2010.01.04 00:00 | buy | 1 | 0.10 | 1.61277 | 0.00000 | 0.00000 | ||
| 2 | 2010.01.04 01:00 | buy | 2 | 0.20 | 1.61425 | 0.00000 | 0.00000 | ||
| 3 | 2010.01.12 00:00 | buy | 3 | 0.30 | 1.61196 | 0.00000 | 0.00000 | ||
| 4 | 2010.01.12 01:00 | buy | 4 | 0.40 | 1.61149 | 0.00000 | 0.00000 | ||
| 5 | 2010.02.03 00:00 | buy | 5 | 0.50 | 1.59813 | 0.00000 | 0.00000 | ||
| 6 | 2010.02.03 01:00 | buy | 6 | 0.60 | 1.59936 | 0.00000 | 0.00000 | ||
| 7 | 2010.02.05 19:45 | close at stop | 6 | 0.60 | 1.55781 | 0.00000 | 0.00000 | -2492.76 | 7507.24 |
| 8 | 2010.02.05 19:45 | close at stop | 5 | 0.50 | 1.55781 | 0.00000 | 0.00000 | -2015.80 | 5491.44 |
| 9 | 2010.02.05 19:45 | close at stop | 4 | 0.40 | 1.55781 | 0.00000 | 0.00000 | -2146.16 | 3345.28 |
| 10 | 2010.02.05 19:45 | close at stop | 3 | 0.30 | 1.55781 | 0.00000 | 0.00000 | -1623.72 | 1721.56 |
| 11 | 2010.02.05 19:45 | close at stop | 2 | 0.20 | 1.55781 | 0.00000 | 0.00000 | -1128.12 | 593.44 |
| 12 | 2010.02.05 19:45 | close at stop | 1 | 0.10 | 1.55781 | 0.00000 | 0.00000 | -549.26 | 44.18 |