Strategy Tester Report
AlpariUK-Demo (Build 225)
| Symbol | GBPUSD (Great Britain Pound vs US Dollar) | ||||
| Period | 1 Hour (H1) 2010.01.04 00:00 - 2010.02.26 22:00 (2010.01.01 - 2010.02.27) | ||||
| Model | Control points (a very crude method, the results must not be considered) | ||||
| Parameters | Lots=1; Stop_Loss=1000; Take_Profit=1000; Trailing_Stop=0; map=25; mash=1; Vlim=50; fper=12; sper=26; sigper=9; stop=300; hedg=1; kh=10; lok=0; rpr=1; ttime=900; hstop=-3000; | ||||
| Bars in test | 1953 | Ticks modelled | 24825 | Modelling quality | n/a |
| Mismatched charts errors | 0 | ||||
| Initial deposit | 10000.00 | ||||
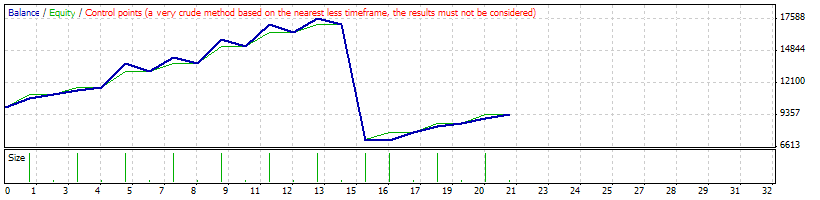
| Total net profit | -641.50 | Gross profit | 12420.50 | Gross loss | -13062.00 |
| Profit factor | 0.95 | Expected payoff | -30.55 | ||
| Absolute drawdown | 4262.50 | Maximal drawdown | 10127.00 (59.09%) | Relative drawdown | 59.09% (10127.00) |
| Total trades | 21 | Short positions (won %) | 10 (90.00%) | Long positions (won %) | 11 (54.55%) |
| Profit trades (% of total) | 15 (71.43%) | Loss trades (% of total) | 6 (28.57%) | ||
| Largest | profit trade | 2090.00 | loss trade | -10000.00 | |
| Average | profit trade | 828.03 | loss trade | -2177.00 | |
| Maximum | consecutive wins (profit in money) | 6 (2220.00) | consecutive losses (loss in money) | 2 (-10513.00) | |
| Maximal | consecutive profit (count of wins) | 3730.50 (5) | consecutive loss (count of losses) | -10513.00 (2) | |
| Average | consecutive wins | 3 | consecutive losses | 1 | |
| # | Time | Type | Order | Size | Price | S / L | T / P | Profit | Balance |
| 1 | 2010.01.11 23:20 | sell | 1 | 1.00 | 1.60999 | 1.61999 | 1.59999 | ||
| 2 | 2010.01.12 02:50 | sell | 2 | 10.00 | 1.60747 | 1.61747 | 1.59747 | ||
| 3 | 2010.01.12 03:20 | close | 2 | 10.00 | 1.60669 | 1.61747 | 1.59747 | 780.00 | 10780.00 |
| 4 | 2010.01.12 03:20 | close | 1 | 1.00 | 1.60669 | 1.61999 | 1.59999 | 327.50 | 11107.50 |
| 5 | 2010.01.14 02:15 | sell | 3 | 1.00 | 1.62899 | 1.63899 | 1.61899 | ||
| 6 | 2010.01.14 09:02 | sell | 4 | 10.00 | 1.62670 | 1.63670 | 1.61670 | ||
| 7 | 2010.01.14 13:15 | close | 4 | 10.00 | 1.62636 | 1.63670 | 1.61670 | 340.00 | 11447.50 |
| 8 | 2010.01.14 13:15 | close | 3 | 1.00 | 1.62636 | 1.63899 | 1.61899 | 263.00 | 11710.50 |
| 9 | 2010.02.01 11:00 | buy | 5 | 1.00 | 1.59244 | 1.58244 | 1.60244 | ||
| 10 | 2010.02.01 11:15 | sell | 6 | 10.00 | 1.58841 | 1.59841 | 1.57841 | ||
| 11 | 2010.02.01 11:20 | close | 6 | 10.00 | 1.58639 | 1.59841 | 1.57841 | 2020.00 | 13730.50 |
| 12 | 2010.02.01 11:20 | close | 5 | 1.00 | 1.58583 | 1.58244 | 1.60244 | -661.00 | 13069.50 |
| 13 | 2010.02.04 06:02 | buy | 7 | 1.00 | 1.59017 | 1.58017 | 1.60017 | ||
| 14 | 2010.02.04 08:07 | sell | 8 | 10.00 | 1.58686 | 1.59686 | 1.57686 | ||
| 15 | 2010.02.04 10:20 | close | 8 | 10.00 | 1.58564 | 1.59686 | 1.57686 | 1220.00 | 14289.50 |
| 16 | 2010.02.04 10:20 | close | 7 | 1.00 | 1.58508 | 1.58017 | 1.60017 | -509.00 | 13780.50 |
| 17 | 2010.02.05 07:00 | buy | 9 | 1.00 | 1.57319 | 1.56319 | 1.58319 | ||
| 18 | 2010.02.05 08:45 | sell | 10 | 10.00 | 1.56930 | 1.57930 | 1.55930 | ||
| 19 | 2010.02.05 08:50 | close | 10 | 10.00 | 1.56721 | 1.57930 | 1.55930 | 2090.00 | 15870.50 |
| 20 | 2010.02.05 08:50 | close | 9 | 1.00 | 1.56665 | 1.56319 | 1.58319 | -654.00 | 15216.50 |
| 21 | 2010.02.05 15:00 | buy | 11 | 1.00 | 1.57256 | 1.56256 | 1.58256 | ||
| 22 | 2010.02.05 15:15 | sell | 12 | 10.00 | 1.56777 | 1.57777 | 1.55777 | ||
| 23 | 2010.02.05 15:20 | close | 12 | 10.00 | 1.56587 | 1.57777 | 1.55777 | 1900.00 | 17116.50 |
| 24 | 2010.02.05 15:20 | close | 11 | 1.00 | 1.56531 | 1.56256 | 1.58256 | -725.00 | 16391.50 |
| 25 | 2010.02.08 02:00 | buy | 13 | 1.00 | 1.56235 | 1.55235 | 1.57235 | ||
| 26 | 2010.02.08 03:20 | sell | 14 | 10.00 | 1.55904 | 1.56904 | 1.54904 | ||
| 27 | 2010.02.08 07:10 | close | 14 | 10.00 | 1.55778 | 1.56904 | 1.54904 | 1260.00 | 17651.50 |
| 28 | 2010.02.08 07:10 | close | 13 | 1.00 | 1.55722 | 1.55235 | 1.57235 | -513.00 | 17138.50 |
| 29 | 2010.02.08 12:00 | buy | 15 | 1.00 | 1.55831 | 1.54831 | 1.56831 | ||
| 30 | 2010.02.08 13:20 | sell | 16 | 10.00 | 1.55490 | 1.56490 | 1.54490 | ||
| 31 | 2010.02.08 17:10 | s/l | 16 | 10.00 | 1.56490 | 1.56490 | 1.54490 | -10000.00 | 7138.50 |
| 32 | 2010.02.08 17:10 | buy | 17 | 10.00 | 1.56540 | 1.55540 | 1.57540 | ||
| 33 | 2010.02.08 17:15 | close | 17 | 10.00 | 1.56542 | 1.55540 | 1.57540 | 20.00 | 7158.50 |
| 34 | 2010.02.08 17:15 | close | 15 | 1.00 | 1.56542 | 1.54831 | 1.56831 | 711.00 | 7869.50 |
| 35 | 2010.02.12 21:00 | buy | 18 | 1.00 | 1.56713 | 1.55713 | 1.57713 | ||
| 36 | 2010.02.12 22:03 | buy | 19 | 10.00 | 1.56931 | 1.55931 | 1.57931 | ||
| 37 | 2010.02.12 22:10 | close | 19 | 10.00 | 1.56979 | 1.55931 | 1.57931 | 480.00 | 8349.50 |
| 38 | 2010.02.12 22:10 | close | 18 | 1.00 | 1.56979 | 1.55713 | 1.57713 | 266.00 | 8615.50 |
| 39 | 2010.02.18 18:45 | buy | 20 | 1.00 | 1.55982 | 1.54982 | 1.56982 | ||
| 40 | 2010.02.18 19:45 | buy | 21 | 10.00 | 1.56230 | 1.55230 | 1.57230 | ||
| 41 | 2010.02.18 19:50 | close | 21 | 10.00 | 1.56275 | 1.55230 | 1.57230 | 450.00 | 9065.50 |
| 42 | 2010.02.18 19:50 | close | 20 | 1.00 | 1.56275 | 1.54982 | 1.56982 | 293.00 | 9358.50 |