Strategy Tester Report
gaps_v1
AlpariUK-Demo (Build 225)
| Symbol | GBPUSD (Great Britain Pound vs US Dollar) | ||||
| Period | 1 Hour (H1) 2010.01.04 00:00 - 2010.02.26 22:00 (2010.01.01 - 2010.02.27) | ||||
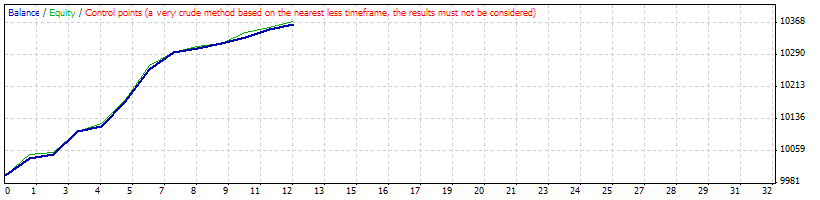
| Model | Control points (a very crude method, the results must not be considered) | ||||
| Parameters | min_gapsize=1; lotsize_gap=0.2; | ||||
| Bars in test | 1953 | Ticks modelled | 24825 | Modelling quality | n/a |
| Mismatched charts errors | 0 | ||||
| Initial deposit | 10000.00 | ||||
| Total net profit | 364.40 | Gross profit | 364.40 | Gross loss | 0.00 |
| Profit factor | Expected payoff | 30.37 | |||
| Absolute drawdown | 756.20 | Maximal drawdown | 805.60 (8.02%) | Relative drawdown | 8.02% (805.60) |
| Total trades | 12 | Short positions (won %) | 5 (100.00%) | Long positions (won %) | 7 (100.00%) |
| Profit trades (% of total) | 12 (100.00%) | Loss trades (% of total) | 0 (0.00%) | ||
| Largest | profit trade | 77.00 | loss trade | 0.00 | |
| Average | profit trade | 30.37 | loss trade | 0.00 | |
| Maximum | consecutive wins (profit in money) | 12 (364.40) | consecutive losses (loss in money) | 0 (0.00) | |
| Maximal | consecutive profit (count of wins) | 364.40 (12) | consecutive loss (count of losses) | 0.00 (0) | |
| Average | consecutive wins | 12 | consecutive losses | 0 | |
| # | Time | Type | Order | Size | Price | S / L | T / P | Profit | Balance |
| 1 | 2010.01.04 00:00 | buy | 1 | 0.20 | 1.61232 | 0.00000 | 1.61430 | ||
| 2 | 2010.01.04 00:20 | t/p | 1 | 0.20 | 1.61430 | 0.00000 | 1.61430 | 39.60 | 10039.60 |
| 3 | 2010.01.08 14:00 | buy | 2 | 0.20 | 1.59798 | 0.00000 | 1.59847 | ||
| 4 | 2010.01.08 14:10 | t/p | 2 | 0.20 | 1.59847 | 0.00000 | 1.59847 | 9.80 | 10049.40 |
| 5 | 2010.01.11 00:00 | sell | 3 | 0.20 | 1.60579 | 0.00000 | 1.60251 | ||
| 6 | 2010.01.29 16:07 | t/p | 3 | 0.20 | 1.60251 | 0.00000 | 1.60251 | 55.60 | 10105.00 |
| 7 | 2010.01.29 16:30 | sell | 4 | 0.20 | 1.60622 | 0.00000 | 1.60562 | ||
| 8 | 2010.01.29 16:43 | t/p | 4 | 0.20 | 1.60562 | 0.00000 | 1.60562 | 12.00 | 10117.00 |
| 9 | 2010.02.01 00:00 | buy | 5 | 0.20 | 1.59455 | 0.00000 | 1.59757 | ||
| 10 | 2010.02.01 08:20 | t/p | 5 | 0.20 | 1.59757 | 0.00000 | 1.59757 | 60.40 | 10177.40 |
| 11 | 2010.02.08 00:00 | buy | 6 | 0.20 | 1.55981 | 0.00000 | 1.56366 | ||
| 12 | 2010.02.08 16:50 | t/p | 6 | 0.20 | 1.56366 | 0.00000 | 1.56366 | 77.00 | 10254.40 |
| 13 | 2010.02.15 00:00 | buy | 7 | 0.20 | 1.56678 | 0.00000 | 1.56889 | ||
| 14 | 2010.02.15 09:46 | t/p | 7 | 0.20 | 1.56889 | 0.00000 | 1.56889 | 42.20 | 10296.60 |
| 15 | 2010.02.15 21:30 | buy | 8 | 0.20 | 1.56599 | 0.00000 | 1.56648 | ||
| 16 | 2010.02.15 23:45 | t/p | 8 | 0.20 | 1.56648 | 0.00000 | 1.56648 | 9.80 | 10306.40 |
| 17 | 2010.02.17 23:00 | sell | 9 | 0.20 | 1.56737 | 0.00000 | 1.56677 | ||
| 18 | 2010.02.17 23:20 | t/p | 9 | 0.20 | 1.56677 | 0.00000 | 1.56677 | 12.00 | 10318.40 |
| 19 | 2010.02.22 00:00 | buy | 10 | 0.20 | 1.54559 | 0.00000 | 1.54635 | ||
| 20 | 2010.02.22 00:50 | t/p | 10 | 0.20 | 1.54635 | 0.00000 | 1.54635 | 15.20 | 10333.60 |
| 21 | 2010.02.22 00:50 | sell | 11 | 0.20 | 1.54688 | 0.00000 | 1.54594 | ||
| 22 | 2010.02.22 00:57 | t/p | 11 | 0.20 | 1.54594 | 0.00000 | 1.54594 | 18.80 | 10352.40 |
| 23 | 2010.02.26 10:30 | sell | 12 | 0.20 | 1.53150 | 0.00000 | 1.53090 | ||
| 24 | 2010.02.26 10:35 | t/p | 12 | 0.20 | 1.53090 | 0.00000 | 1.53090 | 12.00 | 10364.40 |