Strategy Tester Report
One_in_Day1
AlpariUK-Demo (Build 225)
| Symbol | GBPUSD (Great Britain Pound vs US Dollar) | ||||
| Period | 1 Hour (H1) 2010.01.04 00:00 - 2010.02.26 22:00 (2010.01.01 - 2010.02.27) | ||||
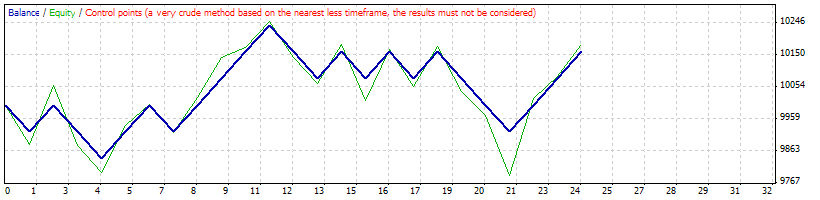
| Model | Control points (a very crude method, the results must not be considered) | ||||
| Parameters | StartHr=0; StartMin=0; StopLoss=80; TakeProfit=80; Lots=1; DaysOfClose=1; TS_Mode=0; TS_Trigger=12; TS_Sensitivity=12; emaFast=12; emaSlow=26; signalPeriod=9; timeFrame=0; | ||||
| Bars in test | 1953 | Ticks modelled | 24825 | Modelling quality | n/a |
| Mismatched charts errors | 0 | ||||
| Initial deposit | 10000.00 | ||||
| Total net profit | 160.00 | Gross profit | 1040.00 | Gross loss | -880.00 |
| Profit factor | 1.18 | Expected payoff | 6.67 | ||
| Absolute drawdown | 224.00 | Maximal drawdown | 411.00 (3.99%) | Relative drawdown | 3.99% (411.00) |
| Total trades | 24 | Short positions (won %) | 7 (57.14%) | Long positions (won %) | 17 (52.94%) |
| Profit trades (% of total) | 13 (54.17%) | Loss trades (% of total) | 11 (45.83%) | ||
| Largest | profit trade | 80.00 | loss trade | -80.00 | |
| Average | profit trade | 80.00 | loss trade | -80.00 | |
| Maximum | consecutive wins (profit in money) | 4 (320.00) | consecutive losses (loss in money) | 3 (-240.00) | |
| Maximal | consecutive profit (count of wins) | 320.00 (4) | consecutive loss (count of losses) | -240.00 (3) | |
| Average | consecutive wins | 2 | consecutive losses | 2 | |
| # | Time | Type | Order | Size | Price | S / L | T / P | Profit | Balance |
| 1 | 2010.01.04 00:00 | sell | 1 | 1.00 | 1.61221 | 1.61301 | 1.61141 | ||
| 2 | 2010.01.04 00:10 | s/l | 1 | 1.00 | 1.61301 | 1.61301 | 1.61141 | -80.00 | 9920.00 |
| 3 | 2010.01.05 00:00 | buy | 2 | 1.00 | 1.60891 | 1.60811 | 1.60971 | ||
| 4 | 2010.01.05 00:15 | t/p | 2 | 1.00 | 1.60971 | 1.60811 | 1.60971 | 80.00 | 10000.00 |
| 5 | 2010.01.06 00:00 | buy | 3 | 1.00 | 1.59873 | 1.59793 | 1.59953 | ||
| 6 | 2010.01.06 00:15 | s/l | 3 | 1.00 | 1.59793 | 1.59793 | 1.59953 | -80.00 | 9920.00 |
| 7 | 2010.01.11 00:00 | sell | 4 | 1.00 | 1.60579 | 1.60659 | 1.60499 | ||
| 8 | 2010.01.11 00:15 | s/l | 4 | 1.00 | 1.60659 | 1.60659 | 1.60499 | -80.00 | 9840.00 |
| 9 | 2010.01.12 00:00 | sell | 5 | 1.00 | 1.61140 | 1.61220 | 1.61060 | ||
| 10 | 2010.01.12 00:20 | t/p | 5 | 1.00 | 1.61060 | 1.61220 | 1.61060 | 80.00 | 9920.00 |
| 11 | 2010.01.13 00:00 | sell | 6 | 1.00 | 1.61674 | 1.61754 | 1.61594 | ||
| 12 | 2010.01.13 00:10 | t/p | 6 | 1.00 | 1.61594 | 1.61754 | 1.61594 | 80.00 | 10000.00 |
| 13 | 2010.01.14 00:00 | sell | 7 | 1.00 | 1.62648 | 1.62728 | 1.62568 | ||
| 14 | 2010.01.14 00:10 | s/l | 7 | 1.00 | 1.62728 | 1.62728 | 1.62568 | -80.00 | 9920.00 |
| 15 | 2010.01.18 00:00 | buy | 8 | 1.00 | 1.62704 | 1.62624 | 1.62784 | ||
| 16 | 2010.01.18 00:20 | t/p | 8 | 1.00 | 1.62784 | 1.62624 | 1.62784 | 80.00 | 10000.00 |
| 17 | 2010.01.20 00:00 | sell | 9 | 1.00 | 1.63620 | 1.63700 | 1.63540 | ||
| 18 | 2010.01.20 00:32 | t/p | 9 | 1.00 | 1.63540 | 1.63700 | 1.63540 | 80.00 | 10080.00 |
| 19 | 2010.01.25 00:00 | buy | 10 | 1.00 | 1.61093 | 1.61013 | 1.61173 | ||
| 20 | 2010.01.25 00:10 | t/p | 10 | 1.00 | 1.61173 | 1.61013 | 1.61173 | 80.00 | 10160.00 |
| 21 | 2010.01.28 00:00 | sell | 11 | 1.00 | 1.61776 | 1.61856 | 1.61696 | ||
| 22 | 2010.01.28 00:15 | t/p | 11 | 1.00 | 1.61696 | 1.61856 | 1.61696 | 80.00 | 10240.00 |
| 23 | 2010.01.29 00:00 | buy | 12 | 1.00 | 1.61254 | 1.61174 | 1.61334 | ||
| 24 | 2010.01.29 00:32 | s/l | 12 | 1.00 | 1.61174 | 1.61174 | 1.61334 | -80.00 | 10160.00 |
| 25 | 2010.02.01 00:00 | buy | 13 | 1.00 | 1.59455 | 1.59375 | 1.59535 | ||
| 26 | 2010.02.01 00:07 | s/l | 13 | 1.00 | 1.59375 | 1.59375 | 1.59535 | -80.00 | 10080.00 |
| 27 | 2010.02.04 00:00 | buy | 14 | 1.00 | 1.59017 | 1.58937 | 1.59097 | ||
| 28 | 2010.02.04 00:15 | t/p | 14 | 1.00 | 1.59097 | 1.58937 | 1.59097 | 80.00 | 10160.00 |
| 29 | 2010.02.05 00:00 | buy | 15 | 1.00 | 1.57662 | 1.57582 | 1.57742 | ||
| 30 | 2010.02.05 00:32 | s/l | 15 | 1.00 | 1.57582 | 1.57582 | 1.57742 | -80.00 | 10080.00 |
| 31 | 2010.02.08 00:00 | buy | 16 | 1.00 | 1.55981 | 1.55901 | 1.56061 | ||
| 32 | 2010.02.08 00:07 | t/p | 16 | 1.00 | 1.56061 | 1.55901 | 1.56061 | 80.00 | 10160.00 |
| 33 | 2010.02.09 00:00 | buy | 17 | 1.00 | 1.55900 | 1.55820 | 1.55980 | ||
| 34 | 2010.02.09 00:40 | s/l | 17 | 1.00 | 1.55820 | 1.55820 | 1.55980 | -80.00 | 10080.00 |
| 35 | 2010.02.11 00:00 | buy | 18 | 1.00 | 1.55986 | 1.55906 | 1.56066 | ||
| 36 | 2010.02.11 00:20 | t/p | 18 | 1.00 | 1.56066 | 1.55906 | 1.56066 | 80.00 | 10160.00 |
| 37 | 2010.02.16 00:00 | buy | 19 | 1.00 | 1.56672 | 1.56592 | 1.56752 | ||
| 38 | 2010.02.16 01:20 | s/l | 19 | 1.00 | 1.56592 | 1.56592 | 1.56752 | -80.00 | 10080.00 |
| 39 | 2010.02.18 00:00 | buy | 20 | 1.00 | 1.56816 | 1.56736 | 1.56896 | ||
| 40 | 2010.02.18 01:15 | s/l | 20 | 1.00 | 1.56736 | 1.56736 | 1.56896 | -80.00 | 10000.00 |
| 41 | 2010.02.19 00:00 | buy | 21 | 1.00 | 1.54799 | 1.54719 | 1.54879 | ||
| 42 | 2010.02.19 00:02 | s/l | 21 | 1.00 | 1.54719 | 1.54719 | 1.54879 | -80.00 | 9920.00 |
| 43 | 2010.02.19 00:02 | buy | 22 | 1.00 | 1.54600 | 1.54520 | 1.54680 | ||
| 44 | 2010.02.19 00:10 | t/p | 22 | 1.00 | 1.54680 | 1.54520 | 1.54680 | 80.00 | 10000.00 |
| 45 | 2010.02.24 00:00 | buy | 23 | 1.00 | 1.54361 | 1.54281 | 1.54441 | ||
| 46 | 2010.02.24 00:50 | t/p | 23 | 1.00 | 1.54441 | 1.54281 | 1.54441 | 80.00 | 10080.00 |
| 47 | 2010.02.25 00:00 | buy | 24 | 1.00 | 1.54088 | 1.54008 | 1.54168 | ||
| 48 | 2010.02.25 00:20 | t/p | 24 | 1.00 | 1.54168 | 1.54008 | 1.54168 | 80.00 | 10160.00 |