Strategy Tester Report
ThePuncher
AlpariUK-Demo (Build 225)
| Symbol | GBPUSD (Great Britain Pound vs US Dollar) | ||||
| Period | 1 Hour (H1) 2010.01.04 00:00 - 2010.02.26 22:00 (2010.01.01 - 2010.02.27) | ||||
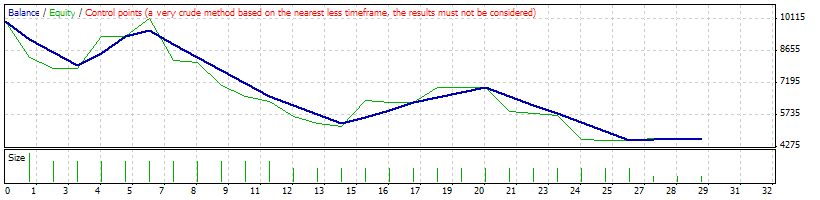
| Model | Control points (a very crude method, the results must not be considered) | ||||
| Parameters | Lots=200; StopLoss=2000; TakeProfit=0; TradeAtCloseBar=false; TrailingStop=0; TrailingStep=1; BreakEven=0; MagicNumber=0; Repeat=3; Periods=5; UseAlert=false; SendEmail=true; TradeLog="MasterMind"; Slippage=3; Indicator_Setting="---------- Indicator Setting"; Crash=false; TimeFrame=0; Length=5; Method=3; Smoothing=1; Filter=5; RealTime=false; Steady=false; Color=false; Alerts=false; EmailON=false; SignalPrice=false; SignalPriceBUY=Black; SignalPriceSELL=Black; CountBars=1485; | ||||
| Bars in test | 1953 | Ticks modelled | 24825 | Modelling quality | n/a |
| Mismatched charts errors | 0 | ||||
| Initial deposit | 10000.00 | ||||
| Total net profit | -5351.76 | Gross profit | 3276.56 | Gross loss | -8628.32 |
| Profit factor | 0.38 | Expected payoff | -184.54 | ||
| Absolute drawdown | 5602.56 | Maximal drawdown | 7641.96 (63.47%) | Relative drawdown | 63.47% (7641.96) |
| Total trades | 29 | Short positions (won %) | 8 (62.50%) | Long positions (won %) | 21 (33.33%) |
| Profit trades (% of total) | 12 (41.38%) | Loss trades (% of total) | 17 (58.62%) | ||
| Largest | profit trade | 747.72 | loss trade | -806.72 | |
| Average | profit trade | 273.05 | loss trade | -507.55 | |
| Maximum | consecutive wins (profit in money) | 6 (1612.64) | consecutive losses (loss in money) | 8 (-4200.00) | |
| Maximal | consecutive profit (count of wins) | 1612.64 (6) | consecutive loss (count of losses) | -4200.00 (8) | |
| Average | consecutive wins | 4 | consecutive losses | 6 | |
| # | Time | Type | Order | Size | Price | S / L | T / P | Profit | Balance |
| 1 | 2010.01.04 11:20 | sell | 1 | 0.30 | 1.62407 | 1.64407 | 0.00000 | ||
| 2 | 2010.01.04 11:25 | sell | 2 | 0.30 | 1.62365 | 1.64365 | 0.00000 | ||
| 3 | 2010.01.11 11:20 | sell | 3 | 0.40 | 1.61648 | 1.63648 | 0.00000 | ||
| 4 | 2010.01.18 11:15 | s/l | 3 | 0.40 | 1.63648 | 1.63648 | 0.00000 | -806.72 | 9193.28 |
| 5 | 2010.01.18 11:20 | sell | 4 | 0.30 | 1.63790 | 1.65790 | 0.00000 | ||
| 6 | 2010.01.19 08:02 | s/l | 2 | 0.30 | 1.64365 | 1.64365 | 0.00000 | -610.80 | 8582.48 |
| 7 | 2010.01.19 08:02 | sell | 5 | 0.30 | 1.64356 | 1.66356 | 0.00000 | ||
| 8 | 2010.01.19 10:32 | s/l | 1 | 0.30 | 1.64407 | 1.64407 | 0.00000 | -610.80 | 7971.68 |
| 9 | 2010.01.21 09:46 | close | 4 | 0.30 | 1.61851 | 1.65790 | 0.00000 | 578.10 | 8549.78 |
| 10 | 2010.01.21 09:59 | close | 5 | 0.30 | 1.61854 | 1.66356 | 0.00000 | 747.72 | 9297.50 |
| 11 | 2010.01.21 10:00 | buy | 6 | 0.30 | 1.61853 | 1.59853 | 0.00000 | ||
| 12 | 2010.01.21 10:20 | buy | 7 | 0.30 | 1.61766 | 1.59766 | 0.00000 | ||
| 13 | 2010.01.21 10:22 | buy | 8 | 0.30 | 1.61812 | 1.59812 | 0.00000 | ||
| 14 | 2010.01.28 10:07 | close | 6 | 0.30 | 1.62756 | 1.59853 | 0.00000 | 270.90 | 9568.40 |
| 15 | 2010.01.29 15:20 | buy | 9 | 0.30 | 1.60377 | 1.58377 | 0.00000 | ||
| 16 | 2010.01.29 22:07 | s/l | 8 | 0.30 | 1.59812 | 1.59812 | 0.00000 | -600.00 | 8968.40 |
| 17 | 2010.01.29 22:07 | buy | 10 | 0.30 | 1.59830 | 1.57830 | 0.00000 | ||
| 18 | 2010.02.01 00:00 | s/l | 7 | 0.30 | 1.59766 | 1.59766 | 0.00000 | -600.00 | 8368.40 |
| 19 | 2010.02.01 00:00 | buy | 11 | 0.30 | 1.59466 | 1.57466 | 0.00000 | ||
| 20 | 2010.02.04 10:50 | s/l | 9 | 0.30 | 1.58377 | 1.58377 | 0.00000 | -600.00 | 7768.40 |
| 21 | 2010.02.04 10:50 | buy | 12 | 0.20 | 1.58381 | 1.56381 | 0.00000 | ||
| 22 | 2010.02.04 16:15 | s/l | 10 | 0.30 | 1.57830 | 1.57830 | 0.00000 | -600.00 | 7168.40 |
| 23 | 2010.02.04 16:15 | buy | 13 | 0.20 | 1.57758 | 1.55758 | 0.00000 | ||
| 24 | 2010.02.04 17:45 | s/l | 11 | 0.30 | 1.57466 | 1.57466 | 0.00000 | -600.00 | 6568.40 |
| 25 | 2010.02.04 17:45 | buy | 14 | 0.20 | 1.57465 | 1.55465 | 0.00000 | ||
| 26 | 2010.02.05 15:50 | s/l | 12 | 0.20 | 1.56381 | 1.56381 | 0.00000 | -400.00 | 6168.40 |
| 27 | 2010.02.05 15:50 | buy | 15 | 0.20 | 1.56168 | 1.54168 | 0.00000 | ||
| 28 | 2010.02.05 19:50 | s/l | 13 | 0.20 | 1.55758 | 1.55758 | 0.00000 | -400.00 | 5768.40 |
| 29 | 2010.02.05 19:50 | buy | 16 | 0.20 | 1.55600 | 1.53600 | 0.00000 | ||
| 30 | 2010.02.08 07:50 | s/l | 14 | 0.20 | 1.55465 | 1.55465 | 0.00000 | -400.00 | 5368.40 |
| 31 | 2010.02.08 07:50 | buy | 17 | 0.20 | 1.55370 | 1.53370 | 0.00000 | ||
| 32 | 2010.02.12 09:07 | close | 15 | 0.20 | 1.57408 | 1.54168 | 0.00000 | 248.00 | 5616.40 |
| 33 | 2010.02.16 08:20 | close | 16 | 0.20 | 1.57235 | 1.53600 | 0.00000 | 327.00 | 5943.40 |
| 34 | 2010.02.16 08:22 | close | 17 | 0.20 | 1.57202 | 1.53370 | 0.00000 | 366.40 | 6309.80 |
| 35 | 2010.02.16 08:25 | sell | 18 | 0.20 | 1.57218 | 1.59218 | 0.00000 | ||
| 36 | 2010.02.16 08:27 | sell | 19 | 0.20 | 1.57199 | 1.59199 | 0.00000 | ||
| 37 | 2010.02.16 08:30 | sell | 20 | 0.20 | 1.57203 | 1.59203 | 0.00000 | ||
| 38 | 2010.02.18 09:20 | close | 18 | 0.20 | 1.56050 | 1.59218 | 0.00000 | 231.68 | 6541.48 |
| 39 | 2010.02.18 09:22 | close | 19 | 0.20 | 1.56107 | 1.59199 | 0.00000 | 216.48 | 6757.96 |
| 40 | 2010.02.18 09:25 | close | 20 | 0.20 | 1.56078 | 1.59203 | 0.00000 | 223.08 | 6981.04 |
| 41 | 2010.02.18 09:27 | buy | 21 | 0.20 | 1.56139 | 1.54139 | 0.00000 | ||
| 42 | 2010.02.18 09:30 | buy | 22 | 0.20 | 1.56138 | 1.54138 | 0.00000 | ||
| 43 | 2010.02.18 09:32 | buy | 23 | 0.20 | 1.56139 | 1.54139 | 0.00000 | ||
| 44 | 2010.02.19 00:50 | s/l | 21 | 0.20 | 1.54139 | 1.54139 | 0.00000 | -400.00 | 6581.04 |
| 45 | 2010.02.19 00:50 | s/l | 22 | 0.20 | 1.54138 | 1.54138 | 0.00000 | -400.00 | 6181.04 |
| 46 | 2010.02.19 00:50 | s/l | 23 | 0.20 | 1.54139 | 1.54139 | 0.00000 | -400.00 | 5781.04 |
| 47 | 2010.02.19 00:50 | buy | 24 | 0.20 | 1.54080 | 1.52080 | 0.00000 | ||
| 48 | 2010.02.19 00:52 | buy | 25 | 0.20 | 1.54240 | 1.52240 | 0.00000 | ||
| 49 | 2010.02.19 00:55 | buy | 26 | 0.20 | 1.54160 | 1.52160 | 0.00000 | ||
| 50 | 2010.02.25 17:20 | s/l | 25 | 0.20 | 1.52240 | 1.52240 | 0.00000 | -400.00 | 5381.04 |
| 51 | 2010.02.25 17:20 | buy | 27 | 0.10 | 1.52188 | 1.50188 | 0.00000 | ||
| 52 | 2010.02.25 17:35 | s/l | 26 | 0.20 | 1.52160 | 1.52160 | 0.00000 | -400.00 | 4981.04 |
| 53 | 2010.02.25 17:35 | buy | 28 | 0.10 | 1.52173 | 1.50173 | 0.00000 | ||
| 54 | 2010.02.25 17:45 | s/l | 24 | 0.20 | 1.52080 | 1.52080 | 0.00000 | -400.00 | 4581.04 |
| 55 | 2010.02.25 17:45 | buy | 29 | 0.10 | 1.52029 | 1.50029 | 0.00000 | ||
| 56 | 2010.02.26 22:56 | close at stop | 29 | 0.10 | 1.52354 | 1.50029 | 0.00000 | 32.50 | 4613.54 |
| 57 | 2010.02.26 22:56 | close at stop | 28 | 0.10 | 1.52354 | 1.50173 | 0.00000 | 18.10 | 4631.64 |
| 58 | 2010.02.26 22:56 | close at stop | 27 | 0.10 | 1.52354 | 1.50188 | 0.00000 | 16.60 | 4648.24 |