Strategy Tester Report
Universal_Investor
AlpariUK-Demo (Build 225)
| Symbol | GBPUSD (Great Britain Pound vs US Dollar) | ||||
| Period | 1 Hour (H1) 2010.01.04 00:00 - 2010.02.26 22:00 (2010.01.01 - 2010.02.27) | ||||
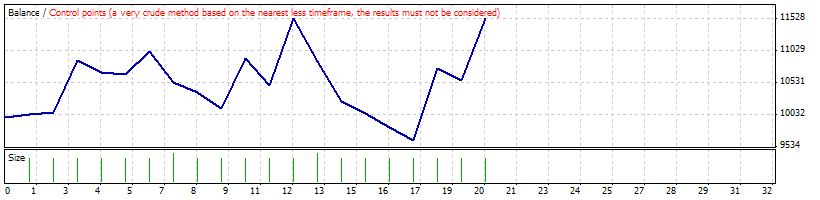
| Model | Control points (a very crude method, the results must not be considered) | ||||
| Parameters | MovingPeriod=23; Magic_ą=1; MaximumRisk=0.05; Lots=0.1; DecreaseFactor=0; | ||||
| Bars in test | 1953 | Ticks modelled | 24825 | Modelling quality | n/a |
| Mismatched charts errors | 0 | ||||
| Initial deposit | 10000.00 | ||||
| Total net profit | 1537.20 | Gross profit | 5174.40 | Gross loss | -3637.20 |
| Profit factor | 1.42 | Expected payoff | 76.86 | ||
| Absolute drawdown | 625.50 | Maximal drawdown | 2923.40 (23.77%) | Relative drawdown | 23.77% (2923.40) |
| Total trades | 20 | Short positions (won %) | 10 (60.00%) | Long positions (won %) | 10 (20.00%) |
| Profit trades (% of total) | 8 (40.00%) | Loss trades (% of total) | 12 (60.00%) | ||
| Largest | profit trade | 1126.60 | loss trade | -675.60 | |
| Average | profit trade | 646.80 | loss trade | -303.10 | |
| Maximum | consecutive wins (profit in money) | 3 (889.00) | consecutive losses (loss in money) | 5 (-1910.20) | |
| Maximal | consecutive profit (count of wins) | 1126.60 (1) | consecutive loss (count of losses) | -1910.20 (5) | |
| Average | consecutive wins | 1 | consecutive losses | 2 | |
| # | Time | Type | Order | Size | Price | S / L | T / P | Profit | Balance |
| 1 | 2010.01.04 00:00 | buy | 1 | 0.50 | 1.61237 | 0.00000 | 0.00000 | ||
| 2 | 2010.01.05 07:00 | close | 1 | 0.50 | 1.61321 | 0.00000 | 0.00000 | 42.00 | 10042.00 |
| 3 | 2010.01.05 09:00 | sell | 2 | 0.50 | 1.60993 | 0.00000 | 0.00000 | ||
| 4 | 2010.01.08 15:00 | close | 2 | 0.50 | 1.60920 | 0.00000 | 0.00000 | 30.50 | 10072.50 |
| 5 | 2010.01.08 15:02 | buy | 3 | 0.50 | 1.60949 | 0.00000 | 0.00000 | ||
| 6 | 2010.01.15 21:00 | close | 3 | 0.50 | 1.62582 | 0.00000 | 0.00000 | 816.50 | 10889.00 |
| 7 | 2010.01.15 21:02 | sell | 4 | 0.50 | 1.62676 | 0.00000 | 0.00000 | ||
| 8 | 2010.01.18 15:00 | close | 4 | 0.50 | 1.63072 | 0.00000 | 0.00000 | -199.20 | 10689.80 |
| 9 | 2010.01.18 16:00 | buy | 5 | 0.50 | 1.63188 | 0.00000 | 0.00000 | ||
| 10 | 2010.01.20 06:00 | close | 5 | 0.50 | 1.63136 | 0.00000 | 0.00000 | -26.00 | 10663.80 |
| 11 | 2010.01.20 06:02 | sell | 6 | 0.50 | 1.63152 | 0.00000 | 0.00000 | ||
| 12 | 2010.01.25 22:00 | close | 6 | 0.50 | 1.62413 | 0.00000 | 0.00000 | 363.50 | 11027.30 |
| 13 | 2010.01.25 22:02 | buy | 7 | 0.60 | 1.62351 | 0.00000 | 0.00000 | ||
| 14 | 2010.01.26 19:00 | close | 7 | 0.60 | 1.61530 | 0.00000 | 0.00000 | -492.60 | 10534.70 |
| 15 | 2010.01.26 19:02 | sell | 8 | 0.50 | 1.61521 | 0.00000 | 0.00000 | ||
| 16 | 2010.01.27 19:00 | close | 8 | 0.50 | 1.61825 | 0.00000 | 0.00000 | -153.20 | 10381.50 |
| 17 | 2010.01.27 19:02 | buy | 9 | 0.50 | 1.61916 | 0.00000 | 0.00000 | ||
| 18 | 2010.01.29 03:00 | close | 9 | 0.50 | 1.61421 | 0.00000 | 0.00000 | -247.50 | 10134.00 |
| 19 | 2010.01.29 03:02 | sell | 10 | 0.50 | 1.61465 | 0.00000 | 0.00000 | ||
| 20 | 2010.02.03 01:00 | close | 10 | 0.50 | 1.59896 | 0.00000 | 0.00000 | 780.90 | 10914.90 |
| 21 | 2010.02.03 01:02 | buy | 11 | 0.50 | 1.59854 | 0.00000 | 0.00000 | ||
| 22 | 2010.02.04 00:00 | close | 11 | 0.50 | 1.59006 | 0.00000 | 0.00000 | -424.00 | 10490.90 |
| 23 | 2010.02.04 00:02 | sell | 12 | 0.50 | 1.58984 | 0.00000 | 0.00000 | ||
| 24 | 2010.02.09 21:00 | close | 12 | 0.50 | 1.56880 | 0.00000 | 0.00000 | 1048.40 | 11539.30 |
| 25 | 2010.02.09 21:03 | buy | 13 | 0.60 | 1.56960 | 0.00000 | 0.00000 | ||
| 26 | 2010.02.10 22:00 | close | 13 | 0.60 | 1.55834 | 0.00000 | 0.00000 | -675.60 | 10863.70 |
| 27 | 2010.02.10 22:03 | sell | 14 | 0.50 | 1.55790 | 0.00000 | 0.00000 | ||
| 28 | 2010.02.11 23:00 | close | 14 | 0.50 | 1.57028 | 0.00000 | 0.00000 | -622.60 | 10241.10 |
| 29 | 2010.02.11 23:02 | buy | 15 | 0.50 | 1.57033 | 0.00000 | 0.00000 | ||
| 30 | 2010.02.15 00:00 | close | 15 | 0.50 | 1.56667 | 0.00000 | 0.00000 | -183.00 | 10058.10 |
| 31 | 2010.02.15 02:00 | sell | 16 | 0.50 | 1.56624 | 0.00000 | 0.00000 | ||
| 32 | 2010.02.15 13:00 | close | 16 | 0.50 | 1.57064 | 0.00000 | 0.00000 | -220.00 | 9838.10 |
| 33 | 2010.02.15 13:02 | buy | 17 | 0.50 | 1.57198 | 0.00000 | 0.00000 | ||
| 34 | 2010.02.18 01:00 | close | 17 | 0.50 | 1.56780 | 0.00000 | 0.00000 | -209.00 | 9629.10 |
| 35 | 2010.02.18 01:02 | sell | 18 | 0.50 | 1.56853 | 0.00000 | 0.00000 | ||
| 36 | 2010.02.22 12:00 | close | 18 | 0.50 | 1.54595 | 0.00000 | 0.00000 | 1126.60 | 10755.70 |
| 37 | 2010.02.22 13:00 | buy | 19 | 0.50 | 1.54724 | 0.00000 | 0.00000 | ||
| 38 | 2010.02.23 20:00 | close | 19 | 0.50 | 1.54355 | 0.00000 | 0.00000 | -184.50 | 10571.20 |
| 39 | 2010.02.23 20:02 | sell | 20 | 0.50 | 1.54314 | 0.00000 | 0.00000 | ||
| 40 | 2010.02.26 22:56 | close at stop | 20 | 0.50 | 1.52370 | 0.00000 | 0.00000 | 966.00 | 11537.20 |