Strategy Tester Report
TrueHedge1
AlpariUK-Demo (Build 225)
| Symbol | GBPUSD (Great Britain Pound vs US Dollar) | ||||
| Period | 1 Hour (H1) 2010.01.04 00:00 - 2010.02.26 22:00 (2010.01.01 - 2010.02.27) | ||||
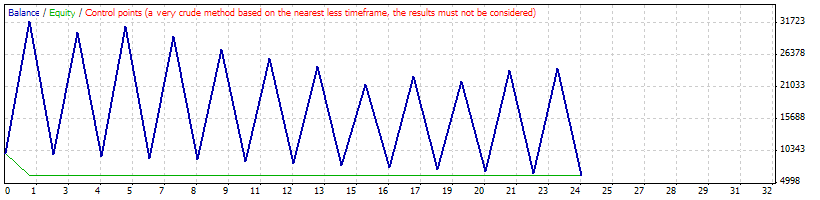
| Model | Control points (a very crude method, the results must not be considered) | ||||
| Parameters | LotSize=2; Slippage=3; StopLoss=0; TakeProfit=100; GMTShift=0; OpenPosHandler=0; MinInitialOrderProfit=500; | ||||
| Bars in test | 1953 | Ticks modelled | 24825 | Modelling quality | n/a |
| Mismatched charts errors | 0 | ||||
| Initial deposit | 10000.00 | ||||
| Total net profit | -3716.80 | Gross profit | 213985.20 | Gross loss | -217702.00 |
| Profit factor | 0.98 | Expected payoff | -154.87 | ||
| Absolute drawdown | 3716.80 | Maximal drawdown | 3716.80 (37.17%) | Relative drawdown | 37.17% (3716.80) |
| Total trades | 24 | Short positions (won %) | 12 (100.00%) | Long positions (won %) | 12 (0.00%) |
| Profit trades (% of total) | 12 (50.00%) | Loss trades (% of total) | 12 (50.00%) | ||
| Largest | profit trade | 21992.00 | loss trade | -22268.00 | |
| Average | profit trade | 17832.10 | loss trade | -18141.83 | |
| Maximum | consecutive wins (profit in money) | 1 (21992.00) | consecutive losses (loss in money) | 1 (-22268.00) | |
| Maximal | consecutive profit (count of wins) | 21992.00 (1) | consecutive loss (count of losses) | -22268.00 (1) | |
| Average | consecutive wins | 1 | consecutive losses | 1 | |
| # | Time | Type | Order | Size | Price | S / L | T / P | Profit | Balance |
| 1 | 2010.01.04 00:00 | buy | 1 | 2.00 | 1.61244 | 0.00000 | 0.00000 | ||
| 2 | 2010.01.04 00:00 | sell | 2 | 2.00 | 1.61221 | 0.00000 | 0.00000 | ||
| 3 | 2010.01.05 00:00 | buy | 3 | 2.00 | 1.60903 | 0.00000 | 0.00000 | ||
| 4 | 2010.01.05 00:00 | sell | 4 | 2.00 | 1.60880 | 0.00000 | 0.00000 | ||
| 5 | 2010.01.06 00:00 | buy | 5 | 2.00 | 1.59885 | 0.00000 | 0.00000 | ||
| 6 | 2010.01.06 00:00 | sell | 6 | 2.00 | 1.59862 | 0.00000 | 0.00000 | ||
| 7 | 2010.01.07 00:00 | buy | 7 | 2.00 | 1.60078 | 0.00000 | 0.00000 | ||
| 8 | 2010.01.07 00:00 | sell | 8 | 2.00 | 1.60055 | 0.00000 | 0.00000 | ||
| 9 | 2010.01.08 00:00 | buy | 9 | 2.00 | 1.59272 | 0.00000 | 0.00000 | ||
| 10 | 2010.01.08 00:00 | sell | 10 | 2.00 | 1.59249 | 0.00000 | 0.00000 | ||
| 11 | 2010.01.11 00:00 | buy | 11 | 2.00 | 1.60602 | 0.00000 | 0.00000 | ||
| 12 | 2010.01.11 00:00 | sell | 12 | 2.00 | 1.60579 | 0.00000 | 0.00000 | ||
| 13 | 2010.01.12 00:00 | buy | 13 | 2.00 | 1.61163 | 0.00000 | 0.00000 | ||
| 14 | 2010.01.12 00:00 | sell | 14 | 2.00 | 1.61140 | 0.00000 | 0.00000 | ||
| 15 | 2010.01.13 00:00 | buy | 15 | 2.00 | 1.61697 | 0.00000 | 0.00000 | ||
| 16 | 2010.01.13 00:00 | sell | 16 | 2.00 | 1.61674 | 0.00000 | 0.00000 | ||
| 17 | 2010.01.14 00:00 | buy | 17 | 2.00 | 1.62671 | 0.00000 | 0.00000 | ||
| 18 | 2010.01.14 00:00 | sell | 18 | 2.00 | 1.62648 | 0.00000 | 0.00000 | ||
| 19 | 2010.01.15 00:00 | buy | 19 | 2.00 | 1.63380 | 0.00000 | 0.00000 | ||
| 20 | 2010.01.15 00:00 | sell | 20 | 2.00 | 1.63357 | 0.00000 | 0.00000 | ||
| 21 | 2010.01.18 00:00 | buy | 21 | 2.00 | 1.62716 | 0.00000 | 0.00000 | ||
| 22 | 2010.01.18 00:00 | sell | 22 | 2.00 | 1.62693 | 0.00000 | 0.00000 | ||
| 23 | 2010.01.19 00:00 | buy | 23 | 2.00 | 1.63488 | 0.00000 | 0.00000 | ||
| 24 | 2010.01.19 00:00 | sell | 24 | 2.00 | 1.63465 | 0.00000 | 0.00000 | ||
| 25 | 2010.02.26 22:56 | close at stop | 24 | 2.00 | 1.52377 | 0.00000 | 0.00000 | 21992.00 | 31992.00 |
| 26 | 2010.02.26 22:56 | close at stop | 23 | 2.00 | 1.52354 | 0.00000 | 0.00000 | -22268.00 | 9724.00 |
| 27 | 2010.02.26 22:56 | close at stop | 22 | 2.00 | 1.52377 | 0.00000 | 0.00000 | 20443.40 | 30167.40 |
| 28 | 2010.02.26 22:56 | close at stop | 21 | 2.00 | 1.52354 | 0.00000 | 0.00000 | -20724.00 | 9443.40 |
| 29 | 2010.02.26 22:56 | close at stop | 20 | 2.00 | 1.52377 | 0.00000 | 0.00000 | 21766.80 | 31210.20 |
| 30 | 2010.02.26 22:56 | close at stop | 19 | 2.00 | 1.52354 | 0.00000 | 0.00000 | -22052.00 | 9158.20 |
| 31 | 2010.02.26 22:56 | close at stop | 18 | 2.00 | 1.52377 | 0.00000 | 0.00000 | 20344.20 | 29502.40 |
| 32 | 2010.02.26 22:56 | close at stop | 17 | 2.00 | 1.52354 | 0.00000 | 0.00000 | -20634.00 | 8868.40 |
| 33 | 2010.02.26 22:56 | close at stop | 16 | 2.00 | 1.52377 | 0.00000 | 0.00000 | 18382.40 | 27250.80 |
| 34 | 2010.02.26 22:56 | close at stop | 15 | 2.00 | 1.52354 | 0.00000 | 0.00000 | -18686.00 | 8564.80 |
| 35 | 2010.02.26 22:56 | close at stop | 14 | 2.00 | 1.52377 | 0.00000 | 0.00000 | 17309.80 | 25874.60 |
| 36 | 2010.02.26 22:56 | close at stop | 13 | 2.00 | 1.52354 | 0.00000 | 0.00000 | -17618.00 | 8256.60 |
| 37 | 2010.02.26 22:56 | close at stop | 12 | 2.00 | 1.52377 | 0.00000 | 0.00000 | 16183.20 | 24439.80 |
| 38 | 2010.02.26 22:56 | close at stop | 11 | 2.00 | 1.52354 | 0.00000 | 0.00000 | -16496.00 | 7943.80 |
| 39 | 2010.02.26 22:56 | close at stop | 10 | 2.00 | 1.52377 | 0.00000 | 0.00000 | 13518.60 | 21462.40 |
| 40 | 2010.02.26 22:56 | close at stop | 9 | 2.00 | 1.52354 | 0.00000 | 0.00000 | -13836.00 | 7626.40 |
| 41 | 2010.02.26 22:56 | close at stop | 8 | 2.00 | 1.52377 | 0.00000 | 0.00000 | 15126.00 | 22752.40 |
| 42 | 2010.02.26 22:56 | close at stop | 7 | 2.00 | 1.52354 | 0.00000 | 0.00000 | -15448.00 | 7304.40 |
| 43 | 2010.02.26 22:56 | close at stop | 6 | 2.00 | 1.52377 | 0.00000 | 0.00000 | 14726.20 | 22030.60 |
| 44 | 2010.02.26 22:56 | close at stop | 5 | 2.00 | 1.52354 | 0.00000 | 0.00000 | -15062.00 | 6968.60 |
| 45 | 2010.02.26 22:56 | close at stop | 4 | 2.00 | 1.52377 | 0.00000 | 0.00000 | 16757.60 | 23726.20 |
| 46 | 2010.02.26 22:56 | close at stop | 3 | 2.00 | 1.52354 | 0.00000 | 0.00000 | -17098.00 | 6628.20 |
| 47 | 2010.02.26 22:56 | close at stop | 2 | 2.00 | 1.52377 | 0.00000 | 0.00000 | 17435.00 | 24063.20 |
| 48 | 2010.02.26 22:56 | close at stop | 1 | 2.00 | 1.52354 | 0.00000 | 0.00000 | -17780.00 | 6283.20 |